

Gold Price History
Considering alternative currencies? Gold bullion remains a top choice.
Valued for millennia, gold offers a proven track record as a store of value and medium of exchange.
This page explores gold's price history, from ancient Egypt (5,000+ years ago) to today's gold rush.
For daily/yearly prices, visit our live gold price page with historical data (post-1968).
Want to learn more? Watch our video on gold's history and current market forces.
Gold Price History (United States - USA)
Most of our website visitors are from the USA and for that reason, we will begin with a chart covering the US dollar price of gold since the founding of the United States of America (USA).
In our nation’s historically brief +240 year history, the price of gold has swung from as low as $20.67 oz to a high close to $2000 oz in the late summer of 2011.
Below we will examine the significant historical dates and charts for US dollar gold prices.
We will begin with a roughly 700-year gold price chart that uses UK gold price data converted into US dollar gold prices going back in time, even before gold-hungry Christopher Columbus and other new world explorers arrived in the Americas.
700 Years of Gold Price History (USA)

Gold Price History via Gold Mining Nation Leaders
Indeed 2020s China Gold Demand and Russian Gold Demand are now at historic levels as they are respectively working and even coordinating to de-dollarize their 21st Century economies further.
Up next is a historical gold price chart that covers the entire history of US dollar gold prices from the year 1776 to 2019.
For the majority of non-war US history, the price of gold was steady at $20.67 per oz USD.
The first significant ramp in the US dollar gold price followed right after the end of the US Civil War. Primarily driven by the issuance of fully fiat Greenback currency bills, the then record US dollar gold price hit as high as $160 oz USD in the year 1869.
All-Time Recorded Gold Price History (USA)

Following the 1933 gold nationalization also known as the US gold confiscation, the US dollar was devalued against gold by almost 70% to an eventually fixed price of $35 oz USD. The portion of US citizens who followed Executive Order 6102, saw their purchasing power lose substantially to gold in 1934.
It was not until the year 1975 with gold that US citizens were again allowed to own more than 3 oz of private gold bullion a piece (the law was for four decades that no more than $100 US dollars in private gold ownership were allowed by US citizens, 1934 through 1974).
Even average contestants on the popular game show called Jeopardy, do not know some of these simple facts. See for yourself on this $800 question.
Below you will find the US dollar gold price from 1925 through 1934.
Gold Price History in the Great Depression 1930s

France Exposes Gold Pool Rigging, Demands Bullion.
After the late 1960’s collapse of the gold price rigging London Gold Pool, the August 1971 Nixon Shock ushered in our current floating fiat currency exchange standard where gold prices seemingly only gain value vs. fiat currencies over the long term.
Below is a chart of gold prices in US dollars during the year 1971.
Fiat US Dollar Gold Price History 1971
The following chart illustrates how the US dollar performed from the then London Gold Pool’s final years up to the year 1974 in gold when the COMEX gold futures contract took over and began dominating in gold price discovery.
Again, US citizens were not allowed to own more than 3 oz of gold bullion each from 1934 to 1974. Given US Treasury cables now disclosed, it is clear the US government was intent on dissuading private gold ownership in mass likely seeing it a threat to the fiat US dollar's power.

US Dollar Gold Price History 1965 - 1974
This chart depicts the historical price of gold relative to the US dollar between 1965 and 1974. It reveals a period of significant fluctuation, with gold prices generally on an upward trend. Understanding these historical trends can provide valuable context for analyzing the current gold market.

South African Gold Krugerrand Coin Begins in 1968
This video is about the South African Mint and Gold Krugerrands. It talks about the history of the Rand Refinery, which is the world's largest gold refining complex, and how it produces gold Krugerrands. The video also goes into detail about the features of Krugerrands, including their design and the fact that they are one of the most widely traded gold bullion coins in the world.
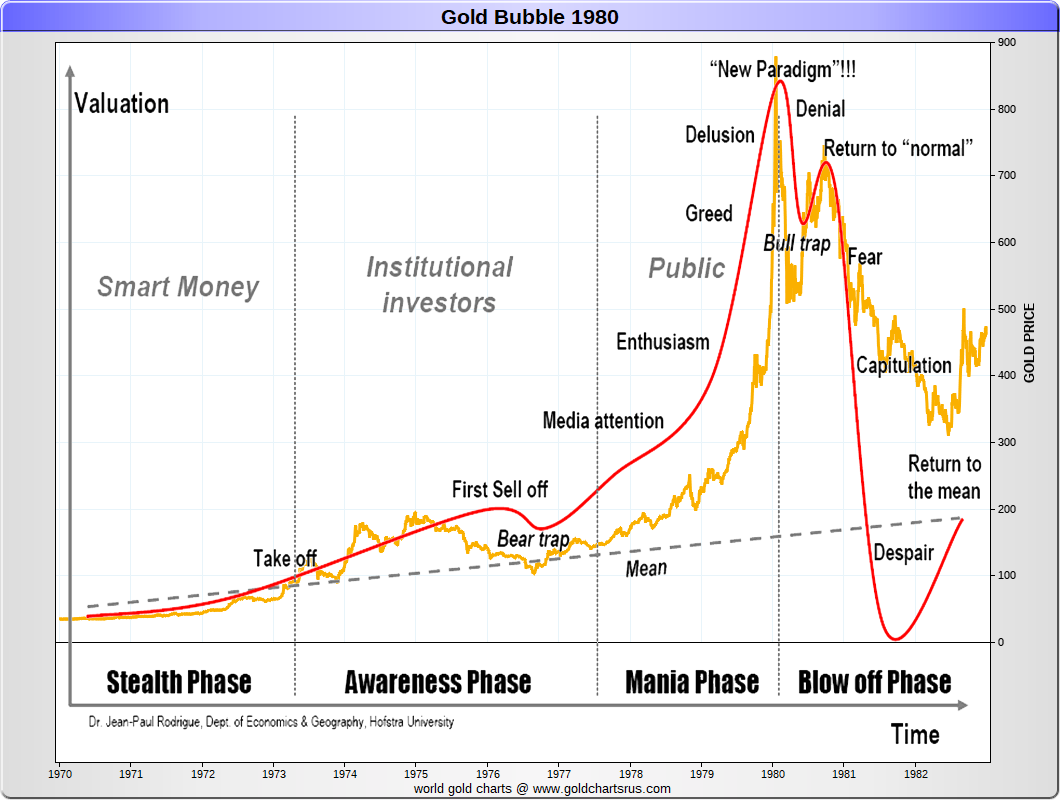
The 1970s 1980 Gold Bull Market
The next chart illustrates US dollar gold prices in its 1970s and 1980 gold bull market, which is currently being dwarfed by this 21st Century Gold Rush ongoing.
21st Century Global Gold Bull Market Ongoing
The 21st century has witnessed a sustained global gold bull market. Driven by factors such as economic uncertainty, inflation concerns, and geopolitical tensions, the price of gold has seen consistent upward pressure. While market conditions fluctuate, the overall trend indicates a strong underlying demand for gold as a safe-haven asset.

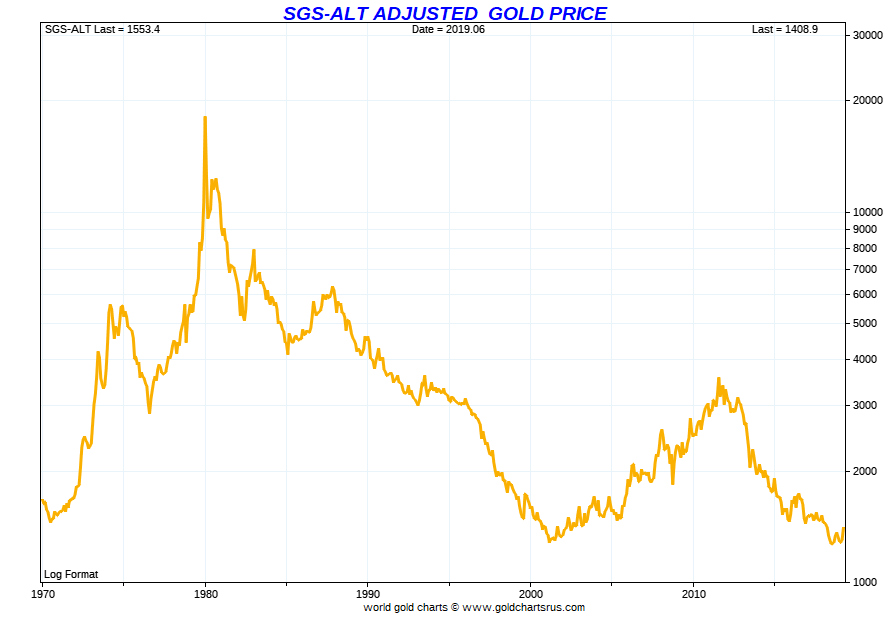
Gold Price History Value Based on Real Inflation Data
Finally, we will use the most accurate historical inflation data available produced by ShadowStats to better understand gold’s US dollar value for our nation’s history.
The chart below uses the ShadowStats Alternative CPI-U Measure, which is an attempt at adjusting government benefiting CPI-U inflation underreporting which has widened since 1980.
The changes in methods used to report inflation have drastically changed over recent decades and were likely designed to move the concept of the CPI (core price inflation) away from being a measure of the cost of living needed to maintain a constant standard of living.
This following chart uses more accurate US dollar price inflation reporting methods in place up to the year 1980.
According to the chart, US dollar gold prices and values were cheapest in the year 2000 and most expensive in late January 1980.
Daily Gold Price Data 1968 - 2023
Click the year of your choice below for both Daily Gold Price History and Yearly Gold Price Charts throughout this ongoing Fiat Currency Era.
Gold Price History (United Kingdom - UK)
This video is about the South African Mint and Gold Krugerrands. It talks about the history of the Rand Refinery, which is the world's largest gold refining complex, and how it produces gold Krugerrands. The video also goes into detail about the features of Krugerrands, including their design and the fact that they are one of the most widely traded gold bullion coins in the world.

Official British Gold Price Data
You can download each year’s official British gold price from 1257 to 1945 by clicking here.
The nearly seven hundred year data set begins with a British gold per ounce price of 0.89 £ oz and ends with multiple centuries of a fixed 4.25 £ oz price for gold in British pounds.
Following World War II the price of gold in British pound terms has almost gone up exponentially eclipsing 1000£ oz for multiyear stretches in this decade (the 2010s).
Historical Gold Prices vs. Silver
One of the best ways to understand gold’s trading value historically is to measure it against its precious monetary cousin, silver.
Investors often use the historic Gold Silver Ratio to understand perhaps which metal may be more undervalued vs. overvalued short, medium, and even in the long term.
Here is a short definition of the gold-silver ratio:
Gold Silver Ratio - (n) a moving ratio measurement of the amount of silver one can buy with a fixed amount of gold. Typically in the western world, the gold to silver ratio is measured by merely dividing the gold spot price by the silver spot price. Weighed in like-kind amounts: grams, kilos, tonnes, troy ounces, etc.
For recorded history, the gold-silver ratio has been as low as 2.5 to a somewhat recent all-time of about 100 in the early 1940s and 1990s. The gold-silver ratio hit about 33 in the spring of 2011 and dropped to as low as about 16 as gold and silver peaked at prices in early 1980.
As of producing this content, the gold-silver ratio has risen near 80. The following long term charts show the respective history of gold vs. silver price ratios in the USA and UK respectively.
USA Historical Gold vs. Silver Price Ratio

Longer-Term Gold Price History vs. Silver
The following content and historical data are from the book called ‘Silver Bonanza,’ authored by James Blanchard III released in 1995.
Mr. Blanchard was a successful businessman and the driving force behind the ‘re-legalization’ of private gold ownership in the USA in 1975.
Only recently have we learned through Wikileaks intercepted US cables that simultaneous efforts were ongoing to discourage US citizenry from buying and saving gold bullion long term (but that is a COMEX and gold price discovery topic for another post).
Below is nearly 5,000 years of gold-silver ratio data:
The more ancient ratios are estimates for long periods of time. Those from 1600 to 1900 (AD) are yearly on periodic averages from Michael G. Mulhall, The Dictionary of Statistics, 4th ed. (London: George Routledge and Sons, 1899) and E.J. Farmer, The Conspiracy Against Silver, or a Plea for Bimetallism (New York: Greenwood Press, 1969; originally published 1886), p. 13.
The other statistics are from Steve Puetz’s Investment Letter, or from our own records. Statistics after 1900 are not yearly averages, but lows or highs that generally did not obtain for long periods. In 1980 the ratio stayed below 20 to 1 for the first two and a half months only, and touched under 16 to 1 for only a few days in January.
|
Time Frame, Era |
Sell 1 oz Gold Bullion |
To buy X oz of Silver |
|
Menes, Egypt 3200 BC |
1 |
2.5 |
|
Egypt, 2700 BC |
1 |
9 |
|
Hammurabi, Mesopotamia, 2700 BC |
1 |
6 |
|
Egypt 1000 BC |
1 |
10.0 |
|
Croesus, Lydia 550 BC |
1 |
13.33 |
|
Persia under Darius, son of Hystaspes (father of Xerxes) |
1 |
13.0 |
|
Plato, ca. 445 BC |
1 |
12.0 |
|
Xenophon (in Persia) |
1 |
11.66 |
|
Menander, ca. 341 BC |
1 |
10.0 |
|
Greece, ca. 300 BC |
1 |
10.0 |
|
Rome, 207 BC |
1 |
14.5 |
|
Rome, 189 BC |
1 |
10.0 |
|
Rome, 40 BC, Julius Caesar |
1 |
7.5 |
|
Rome, Claudius |
1 |
12.5 |
|
Constantine the Great |
1 |
10.5 |
|
Theodosian Code |
1 |
14.4 |
|
Medieval England |
1 |
11.1 |
|
Medieval Italy |
1 |
12.6 |
|
Time Frame, Era |
Sell 1 oz Gold Bullion |
To buy X oz of Silver |
|
Spain, 1497 AD, Edict of Medina |
1 |
10.07 |
|
Germany, 1500 AD |
1 |
10.05 |
|
1600 - 1620 AD |
1 |
12.1 |
|
1700 - 1720 AD |
1 |
15.1 |
|
1800 - 1820 AD |
1 |
15.3 |
|
1821 - 1840 AD |
1 |
15.6 |
|
1841 - 1860 AD |
1 |
15.6 |
|
1861 - 1870 AD |
1 |
15.6 |
|
1871 - 1880 AD |
1 |
16.7 |
|
1881 - 1882 AD |
1 |
17.6 |
|
1883 - 1884 AD |
1 |
18.4 |
|
1885 - 1886 AD |
1 |
19.9 |
|
1887 - 1888 AD |
1 |
21.2 |
|
1890 AD |
1 |
18.3 |
|
1932 AD |
1 |
75.0 |
|
1940 - 1941 AD |
1 |
100.0 |
|
1980 AD |
1 |
16.0 |
|
1991 AD (February) |
1 |
100.0 |
|
2019 AD (December) |
1 |
87.7 |
For further information on gold price history and gold bullion buying best practices, pick up our free SD Bullion Guide.
You can always find fresh up to date gold price information on our live Gold Price Page.
***