

Gold Price Today


Gold Price for Today
View the live gold spot price per troy ounce, gram, and kilogram. You can also see the 24-hour price trend for each weight. Below, you'll find an interactive live gold price chart with historical pricing as well as various historic long term gold price charts.
Metal Performance History
July 23, 2026 3:00 AM EST
| Time | Price | Change
|
Change % |
|---|---|---|---|
| 1 Day | $4,130.15 | -13.11 | -0.32% |
| 7 Days | $3,976.14 | +141.1 | +3.55% |
| 1 Months | $4,111.53 | +5.71 | +0.14% |
| 6 Months | $4,983.64 | -866.405 | -17.39% |
| 1 Years | $3,387.28 | +729.955 | +21.55% |
| 5 Years | $1,802.12 | +2315.115 | +128.47% |
| 10 Years | $1,322.29 | +2794.945 | +211.37% |
| 15 Years | $1,601.25 | +2515.985 | +157.13% |
Understanding the Gold Spot Price
What is the gold spot price?
The gold spot price today is the current market price for one troy ounce of physical gold bullion and serves as the global benchmark for gold transactions. Often referred to as the “gold rate today,” this live price changes continuously throughout the trading week as financial markets open across Asia, Europe, and North America.
Gold spot prices fluctuate based on several key factors, including currency movements, supply and demand for physical gold and derivatives, market speculation, interest rates, inflation expectations, and broader economic conditions. While short-term price movements are important for active traders, long-term gold investors typically focus more on broader market trends rather than daily volatility.
Historically, gold’s long-term value has been driven by fundamental supply and demand dynamics, while short- and medium-term price action is often influenced by futures and derivatives trading on major exchanges such as COMEX and the LBMA. Periods of increased demand from central banks, governments, institutional investors, and retail buyers have historically contributed to higher gold prices over time.
On this page, you’ll find fast-loading charts displaying both the current gold rate today and historical gold price data, helping you track live market movements and long-term trends.
How to Invest in Gold
There are quite a few things you'll need to know in order to use gold as an investment. One of those is the current gold price or spot price of gold. You'll also need to determine how you will be investing. It's possible to buy physical gold in the form of gold bullion, but you can also invest in ETFs, which are essentially paper certificates that attempt to mimic a specific amount of gold.
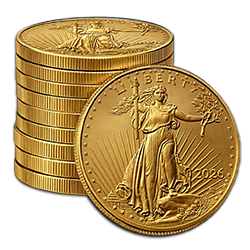
Physical gold is the preferred option for those who are going to be storing gold as a hedge against economic uncertainty, while certificates and bonds can be a better choice for those looking for a shorter-term investment option (think day trading). In addition, certificate holders will never take physical possession of the gold they own, which can be a drawback for some. In terms of gold bullion, you can invest in gold in the form of gold bullion coins like the Canadian Gold Maple Leaf coins or the American Gold Eagle coin, or in gold bars usually measured in grams, ounces, and kilograms.
Other investment options in terms of precious metals include silver bullion, platinum or palladium.
Buy Gold Online
Gold Price Fundamentals
What is the spot price of gold?
The gold spot price is the cost of a single troy ounce of gold. The spot price of gold is set by different authorities in different areas. For instance, in the UK, the LBMA sets the spot price of gold. In the United States and Canada, it's done mostly through New York (COMEX). There are many other gold markets around the world particularly in China and India, the world's largest physical gold buying markets, and all of them have spot and local bullion price markets.How much is 1 gram of gold worth?
One gram of gold is generally worth about 1/31 the price of one troy ounce of gold, as there are 31.1034 grams in one troy ounce. Additionally, the value of 1 gram should account for any applicable premiums. Since 1 gram gold coins, bars and rounds are more expensive to produce, they also generally command higher premiums, thus the retail price paid for a one gram gold bar will exceed its calculated melt weight.Is the gold spot price the cost I'll pay to buy an ounce of gold?
No. The gold spot price does not include dealer premiums or other costs. When you buy physical gold, dealers add a markup above spot to cover minting, operating expenses, and profit. Knowing the spot price helps you judge whether a dealer’s premium is fair.What is the ounce of gold price?
The gold spot price is typically reflecting a troy ounce of gold. The spot price is the value of one troy ounce of gold on the over-the-counter market. However, understand that gold is not always sold by the ounce, although that is one of the most common methods. Gold can also be sold by the gram, kilo, and metric ton. By knowing the gold price per ounce, you know the baseline of what you'll typically pay for one troy ounce of .999 fine gold from a bullion dealer (plus that dealer's and various gold mint markups for business and manufacturing costs).How does the gold bar price vary from the ounce of gold price?
Gold is available in many forms, including gold bars and gold coins. The price of a gold bar depends mainly on its gold content and overall weight. Gold bar sizes can range from small grams to large kilo bars. One-ounce gold bars are typically priced slightly lower per ounce than government-minted bullion coins, while smaller or larger bars vary in price based on size. For example, a one-gram gold bar will cost more per ounce than a one-ounce or one-kilo gold bar. Always confirm the exact gold content before buying or selling to ensure the price fairly reflects the spot price and typical market premiums.What currency are gold prices per ounce offered in?
The US dollar is the standard for international trade, and gold is always traded in fiat US dollars. Even if you're buying in another nation, the dealer will likely have paid for the gold in a close equivalent amount of US dollars, and then simply translated the price to the currency of the nation in question. For instance, a dealer might offer an ounce of gold in British pound sterling, and you might pay for that gold in British pounds; however, the dealer often originally paid for many of their gold bullion product inventory in US dollars. Almost all gold transactions hinge on the ongoing value of the US dollar, no matter where the sale is taking place around the world.How does the strength of the US dollar influence gold prices?
Gold is a scarce and precious commodity. History shows it has been treasured by humanity for thousands of years due to its rarity, utility, liquidity, and enduring value. In contrast, fiat currencies, such as the US Dollar, are only as strong as the country of emission (in this case, the United States) is economically stable and viable. Therefore, whenever the US Dollar is performing poorly, savvy investors will often buy gold to protect their purchasing power. In other words, they convert their savings into gold because it will appreciate against the US Dollar devaluing.Can geopolitical events impact the price of gold?
Yes. Geopolitical events play a crucial role in the ongoing price and value of gold. Because gold is a safe haven asset against economic downturns, any global event that impacts the sense of financial security, or directly impacts mining operations, will create a disturbance in supply and demand for gold, ultimately affecting its price and relative value versus other investment classes.How does the supply and demand for gold influence its price?
Supply and demand are the main drivers of gold fluctuations in the long run. If gold mining operations are down for any reason, the resulting shortage in newly mined gold supply will cause the price of gold to rise. Likewise, if the demand for gold rises substantially as investors seek a safe investment during times of economic instability, so will the price of gold rise.Are there seasonal trends in the price of gold?
Typically, gold prices rise in the second half of the year given seasonal physical demand in the Eastern world. This seasonal trend has been noticed in the past 50 years. One reason is the rise in gold jewelry demand from July to February of the following year, due to the Indian wedding season (summer and early fall) and the Chinese Holiday seasons for instance.How does mining activity influence the supply and price of gold?
Mining activity affects the supply of gold bullion available in the market. If mining activity is affected, that can cause a shortage of gold in the market, increasing its price.What impact do government policies have on gold prices?
Government policies impact gold prices through monetary policy, fiscal actions, and regulatory changes. Interest rates, inflation, deflation, and currency stability can directly influence investors' interest in gold as a safe-haven asset, ultimately affecting its price. Higher real interest rates make gold less attractive, while expansive fiscal policies or geopolitical tensions increase demand. Changes in import/export regulations, taxes, and fluctuations in central bank gold reserves also directly affect the supply and demand dynamics, influencing gold prices.
Factors Influencing Price of Gold
Is the gold price manipulated?
Gold prices are set by global supply and demand across highly liquid markets, but short-term price movements can be influenced by large institutional trading, futures markets, and investor speculation. While there have been isolated cases of misconduct by individual private investors in the past, no single entity controls the gold market. Over the long term, gold’s price is driven by fundamentals such as inflation, interest rates, currency strength, central bank activity, and geopolitical risk.Does the gold market operate 24 hours per day around the world?
Yes, gold is bought and sold at all hours of the day and night, all around the world. Gold is traded 24 hours per day during weekdays Monday-Friday to ensure all have access to this investment market, including banks, governments, other financial institutions, and investors just like you. This market is active in market-making around the clock to guarantee that you can always get an accurate gold price per ounce at any time.How frequently does the gold ounce price change?
Live gold prices change continuously during active market hours. Trading typically runs from Sunday evening through Friday afternoon, with prices updating in real time as global markets in Asia, Europe, and North America overlap. There is a brief daily one-hour pause in U.S. futures trading. Price movements depend on market activity, including breaking news, supply and demand, investor behavior, and developments in currency, bond, and commodity markets.What is the impact of interest rates on gold prices?
Gold and interest rates often have an inverse relationship. Usually, when interest rates go down, the spot price of gold will go up, and vice versa. That happens because in prosperous economic times, interest in safer investments, such as physical gold and other precious metals, is low. Conversely, when economic confidence pales and growth stagnates, the nation's currency usually devalues and investors turn to "safe haven" assets, such as gold, increasing demand and prices.How does global economic instability affect the price of gold?
Global economic instability typically increases demand for gold. During periods of financial stress, recessions, geopolitical conflict, or currency uncertainty, investors often shift capital away from risk assets and into gold as a safe-haven store of value. This rise in demand tends to support higher gold prices, especially when confidence in fiat currencies or traditional markets weakens.What is the relationship between inflation and gold prices?
High price inflation and fiat currency expansion eras mean that the purchasing power of fiat currencies is inevitably declining further. In response to periods of high inflation, investors will turn to safe investments, such as gold and other precious metals, to store value long-term. With the increase in demand, gold prices and overall relative values will also increase in response.Can geopolitical events impact the price of gold?
Yes. Geopolitical events play a crucial role in the ongoing price and value of gold. Because gold is a safe haven asset against economic downturns, any global event that impacts the sense of financial security, or directly impacts mining operations, will create a disturbance in supply and demand for gold, ultimately affecting its price and relative value versus other investment classes.How does the supply and demand for gold influence its price?
Supply and demand are the main drivers of gold fluctuations in the long run. If gold mining operations are down for any reason, the resulting shortage in newly mined gold supply will cause the price of gold to rise. Likewise, if the demand for gold rises substantially as investors seek a safe investment during times of economic instability, so will the price of gold rise.Are there seasonal trends in the price of gold?
Typically, gold prices rise in the second half of the year given seasonal physical demand in the Eastern world. This seasonal trend has been noticed in the past 50 years. One reason is the rise in gold jewelry demand from July to February of the following year, due to the Indian wedding season (summer and early fall) and the Chinese Holiday seasons for instance.How do gold futures contracts affect the current price of gold?
Gold futures contracts are traded on exchanges like COMEX. The price and amount of future contracts reflect traders' expectations or speculation on how the price of gold will move in the future. Because these contracts are standardized and traded publicly, they serve as a key reference for the spot price of gold. The front-month COMEX gold futures directly affect the ongoing spot price of gold.How does mining activity influence the supply and price of gold?
Mining activity affects the supply of gold bullion available in the market. If mining activity is affected, that can cause a shortage of gold in the market, increasing its price.What impact do government policies have on gold prices?
Government policies impact gold prices through monetary policy, fiscal actions, and regulatory changes. Interest rates, inflation, deflation, and currency stability can directly influence investors' interest in gold as a safe-haven asset, ultimately affecting its price. Higher real interest rates make gold less attractive, while expansive fiscal policies or geopolitical tensions increase demand. Changes in import/export regulations, taxes, and fluctuations in central bank gold reserves also directly affect the supply and demand dynamics, influencing gold prices.
Gold Markets and Transactions
From local dealers to global transactions, the gold market's cap is worth trillions of dollars, even if we count only the "above the ground" gold reserves. This section will provide insights into how gold transactions work and key aspects of the gold market.
Is the price of gold I'm quoted going to be the price I pay?
Gold prices change, and they can change quickly, even by the minute. You might wonder if the price you're quoted will be the gold price you pay if the prices fluctuate up and down constantly. The good news is that gold bullion dealers "lock in the price" when your order is placed, so that will be the price of gold you pay regardless of what occurs afterward. If you're buying gold online, then you can lock the price in at the checkout page. Then, you'll have a specific amount of time to pay for your purchase in good funds and keep the current price of gold you locked in. If you take too long, the lock-in is removed, and you'll pay the new price of gold instead (if the gold price changes during that time frame). However, understand that not all gold dealers offer online price lock-ins and purchasing options, so verify this before making any purchase decisions. Typically when dealers do not offer immediate purchase services online, they are often using nontransparent sales tactics with products that ultimately take advantage of novice buyers with exorbitant premiums and price markups.Why is the price different on every bullion dealer's website?
The gold spot price is a fluctuating index that tracks market sales by the minute and rises or falls depending on the law of supply and demand. However, each bullion dealer adds a markup value above the spot price in order to cover business costs and guarantee a profit. That is what is called a "premium". Different dealers charge different premiums, ultimately affecting the final price of a gold bullion product, such as a gold bar or gold coin.Where are the best places to purchase gold?
In most major US metropolitan areas, you can buy gold at brick-and-mortar shops like pawn shops, local coin stores, online through authorized bullion dealers, or through marketplaces such as eBay and Craigslist. Notoriously, buying from respectful online dealers is considered the best practice considering prices and safety. With a larger business operation and economies of scale, high-volume online bullion dealers, such as SD Bullion, are able to offer lower premiums than local dealers, and far safer transactions than individual sellers on marketplaces where counterfeits and fraud are commonplace.
Gold Products: Futures, ETFs, and Bullion
Humankind has desired gold for thousands of years. Now, it is available not only in physical form but also in derivatives that cater to different investment strategies. In this section, you will learn about the unique features of physical gold and how it compares to futures contracts and ETFs.
What's the difference between gold futures contracts and bullion?
Gold futures contracts are generally leveraged promissory notes. They promise that the individual or organization in question will buy or sell a specified amount of gold at a specific time in the future (hence, the name). These contracts may be for a few months down the road, or they may be for years ahead. There are several challenges here.
For instance, the price of gold you'll pay will be significantly higher than buying just a single ounce (most futures contracts represent 100 troy ounces of gold), and the chance for the price of gold to change between the time you buy your futures contract and when you actually take delivery is high. While there is potential for the price to go up, meaning you've saved money, there's an equally good chance that the price might go down, meaning you've paid too much. Leverage often at levels of 25 to 1 represents real risk to those who lose in futures market speculations.
Taking physical delivery through futures contracts is capital-intensive, complex, and antiquated. Often the retail gold bullion buyer is better served by choosing trusted high-volume online bullion dealers instead.
Are gold futures the same as buying physical gold?
While gold futures prices will be similar to the bullion price, it is important to understand that gold futures contracts are not the same as owning the physical precious metal bullion. While you can technically buy a gold futures contract rather than an actual physical ounce of gold, you'll ultimately pay more for your purchase in the end. If you intend to take physical delivery, you'll face fees such as storage, insurance, and delivery charges, which can make the final cost higher than simply purchasing bullion outright. Not all gold futures result in physical delivery, and the number of approved "good delivery" bullion products is limited. When delivery is taken, it's typically in large quantities, such as 100 ounces, which is a standard contract size. Large kilo gold bars are not the typical product size for a retail bullion investor.
Is a unsecured gold ETF the same thing as buying physical gold bullion?
No. An unsecured gold ETF is not the same as owning physical gold bullion. ETFs trade like stocks and settle in cash, meaning investors are not completing ownership of actual metal. Even when an ETF claims to be gold-backed, most investors cannot redeem physical gold, and ongoing management fees can reduce returns. Physical bullion, by contrast, provides direct ownership and long-term security outside the financial system.
Gold Price Trends and Historical Data
Gold prices reflect economic cycles, geopolitical changes, and even societal trends. These factors have shaped gold's trajectory, especially in this fiat currency era. The questions below will give you a broader perspective on how historical data and market trends can create future expectations.
How can I track historical trends in gold prices?
You can track historical trends in gold prices by analyzing our historical gold price data.
What is the highest price gold has gotten to?
On January 28, 2026, the gold spot price closed at an all time high of over $5,500.00 per ounce.
Industrial and Consumer Use of Gold
Does industrial use impact the price of gold?
Yes, gold does have industrial applications often taking up to 10% of annual demand, but its price is less sensitive to industrial demand compared to silver. However, gold still has many unreplaceable applications in high-end electronics, dentistry, and other industrial sectors like aerospace, but these applications have a smaller impact on its price relative to factors like ongoing jewelry, investment demand, and central bank activities. Therefore, high industrial production might drive up gold prices, though to a lesser degree than investment demand and Central Banks' activities.
What is gold used for?
Gold is mainly used in jewelry and as a long-term store of value in bullion formats. However, due to its high conductivity and resistance to corrosion, it has many cutting-edge industrial applications in electronics, medicine, and the underlying internet grid (e.g., servers).
Are gold prices affected by changes in consumer demand for jewelry?
Yes. When gold jewelry demand is high, especially during the second half of the year (wedding and holiday seasons), gold prices will typically rise.
Gold as an Investment
What exactly is gold bullion?
Gold bullion refers to physical gold valued primarily for its metal content rather than rarity or collectability. It is typically produced as gold bars or gold coins with standardized weights and high purity, such as .999 or higher. Gold bullion is bought and sold based on the gold spot price, plus a premium, and is commonly used by investors as a store of value and a hedge against inflation and currency risk.
Is the spot price of gold consistent across different countries?
In theory, yes. The price of gold is typically indexed in USD per Troy Ounce of gold bullion. However, other countries will convert the price in USD to their local currency, which can cause slight differences. Physical bullion premiums or discounts in local markets are often arbitraged away over time.
What types of gold bullion are available for purchase?
The most common types of gold bullion available for purchase are gold bars and gold coins. The standard size for both products in the USA is 1 troy ounce, but fractional sizes (1/2 oz, 1/4 oz, 1/10 oz, 1/20 oz, 1 gram, etc.) and larger options like 5 oz, 10 oz, and 1-kilo bars are also available.
What factors influence the price of gold?
In practical terms, supply and demand are the primary drivers of gold price fluctuations. However, interest rate policies, geopolitical instability, and investor sentiment also influence the price of gold. Typically, gold prices move in the opposite direction of the US Dollar. In times of economic downturn, investors turn to gold as a safe haven, which increases demand and, consequently, prices.
Why is it not possible to buy gold at or below the spot price?
It is usually not possible to buy gold at or below the spot price because the spot price does not account for additional costs like manufacturing, transportation, storage, and dealer markups. These added costs increase the final price above the spot price. Typically anyone trying to sell gold below the spot is a red flag and the outcome is often a scam of some sort. Be alert about possible fraud or counterfeits if you come across gold offers at very low prices.
What is the difference between a troy ounce and a regular ounce when measuring gold?
Precious metals are usually measured in troy ounces rather than the most common avoirdupois ounce. One troy ounce is equal to 1.097 avoirdupois ounces. Converting into grams, 1 troy ounce equals 31.1 grams, while 1 avoirdupois ounce equals 28.3 grams. The gold spot price is indexed in troy ounces.
What are the benefits of investing in gold?
Gold is a precious commodity and hard asset that humankind has valued for millennia. It is considered a safe haven asset and a store of value that protects wealth and purchasing power, especially in times of economic crisis. Governments already own more than 1 in 5 ounces ever mined according to industry data ongoing. They do this because gold bullion will always have value and inspire confidence in monetary regimes.
How do current gold and silver prices relate to one another?
While silver prices are far lower than gold prices, silver can sometimes appreciate substantially relative to gold. Savvy investors often compare the current gold and silver prices to determine the gold-silver ratio, and based on that, they may choose to purchase, sell, and or hold either gold, silver, or both.
What is the difference between gold and silver prices?
Gold prices are typically less volatile than silver prices. There are long durations of time where either respective metal gains in relative value versus the other. In deflationary eras, gold tends to outperform silver. In inflationary expansionist cycles, silver will often outperform gold. During a monetary crisis, gold tends to outperform first and eventually lead silver into a later catch-up rally and outperformance cycle.
What does the gold/silver ratio indicate?
The spot gold-silver ratio indicates the proportional difference between the spot price of gold and the spot price of silver. In other words, if the spot price of gold is $2,500 oz and the spot price of silver is $30 oz, the gold/silver ratio would be 2500/30 = 83.33. The spot gold-silver ratio has swung in the last 55 years to as low as 15 in the 1980 bull market peak, to above 120 briefly during the 2020 Covid crash.
Why do I need to know the past and current prices of gold?
By knowing the current gold price and comparing that with historical gold prices, you can determine whether there is an uptrend, downtrend, or if gold's value is remaining static. Based on this, you can then determine if now is a good time to buy (when prices are low but demand is expected to go up), a good time to sell (if prices are high but expected to go down), or a good time to hold your gold bars or bullion assets for the interim. However, this does require considerable analysis of the historical price of gold and access to accurate gold price charts and historical gold price information.
What will gold be worth in 5 years?
In the last year alone, gold prices increased over 70%. While this bullish market and increased demand may have been caused by specific geopolitical events happening in 2025 and early 2026, there is a case to defend gold prices will continue to climb in the next 5 years.
How does gold perform during a recession compared to other assets?
Because gold is seen as a hedge against inflation and fiat currency devaluation, it typically performs better than other assets during a recession due to the increased demand from investors looking to protect their purchasing power.
What is the gold spot price?
Simply put, the fluctuating gold spot price is today's standard price discovery mechanism used to help set and establish the price of a single troy ounce of physical gold bullion.
The gold spot price plays a critical role in gold sales and live gold price dynamics, as well as in other investment arenas. You will also notice that during market trading hours, beginning in Asia late Sunday nights and throughout the workweek, the gold spot price is not constant – it often fluctuates and changes over the course of trading days. These price fluctuations are usually minor, and should only play a decisive role in ultra-short-term investments, not in long-term gold bullion buying.
Quite a few different factors play a role in determining the spot price at any single time, including currency values, the supply and demand of gold bullion and gold derivatives (e.g. futures contracts, ETFs, options), current events affecting the financial markets and the world at large, market speculation, and more.
With that being said, the impact of governments, central banks, big banks, and even major investors can also affect the current (and future) gold price. For instance, the CME Group's COMEX which mainly dictates the ongoing day to day spot prices for gold around the world. This entity openly encourages non-US central banks to actively trade gold futures contracts amongst other various precious metals, FX, and interest rate critical price discovery futures contracts.
As well, suppose the Federal Reserve began buying up private gold, or the European Central Bank started stockpiling gold bullion heavily. This surge in physical gold demand should cause prices to rise. Most gold bullion investors would need fiat currency offers for their gold many multiples higher than today's price points in order to be moved to selling.
In general the higher the demand for gold bullion, the higher the gold spot price will rise. When major investors (e.g. billionaires) begin buying up large quantities of gold bullion, or gold mines, this can also affect the market and gold prices positively.
In the short to medium term, gold price dynamics can remain mostly influenced by derivatives traded on the COMEX, LBMA, etc. Contrarily the long term price of gold is typically decided by gold's supply-demand fundamental factors.
How to Invest in Gold
There are quite a few things you’ll need to know in order to use gold as an investment. One of those is the current gold price or spot price of gold. You’ll also need to determine how you will be investing. It’s possible to buy physical gold in the form of gold bullion, but you can also invest in ETFs, which are essentially paper certificates that attempt to mimic a specific amount of gold.
Physical gold is the preferred option for those who are going to buy and hold gold as a hedge against economic uncertainty, while certificates can be a better choice for those looking for a shorter-term investment option (think day trading). In addition, certificate holders will never take physical possession of the gold they own, which can be a drawback for some. In terms of gold bullion, you can invest in gold in the form of gold bullion coins like the Canadian Gold Maple Leaf coins or the American Gold Eagle coin, or in gold bars usually measured in grams, ounces, and kilograms.