History of Gold
Gold has played a vital role in a store of value, power, and influence for nearly all recorded history. Gold remains the backstop bedrock asset of government central banking as they currently own about one of every five ounces ever mined.
Silver and gold, the two historic monetary precious metals, underlined most economic development for the last five thousand years of written record-keeping. Physical gold was typically traded by kings and countries, while physical silver was used mainly in everyday goods and services transactions.
The first concrete account of gold value manipulation by an organized society comes from the Ancient Egyptians. Pharaohs and temple priests prized gold and often used it to beautify their image and exert authority over the underclasses.
Historians also believe that the first gold and silver exchange ratio came from Ancient Egypt. The mandate established that one piece of gold should be equivalent to two and a half pieces of silver, arguably the lowest recorded ratio between silver and gold in history.
The Ancient Greeks and the Romans played a significant role in further establishing gold and silver for exchanging goods and services in the centuries that followed.
Often whoever had the most gold made the rules and were the then rulers.
Gold and silver conquest often led to the phenomenon of empires.
Those current and former historic empires often also assist other governments in safekeeping much of their gold bullion and monetary foreign exchange savings.
Governments around the world are still adding to their official gold bullion reserves in 2021.
1 of 2)
— James Anderson (@jameshenryand) February 10, 2020
some new#BankOfEngland#Gold #Bullion vault footage
Each rack of 400 oz gold bars is 1 ton,
so note as he rolls along
The BoE should have 5,000 of those racks spread on top their clay underpinning
Interesting pt about NY Fed vault on bedrock,
see next tweet pic.twitter.com/YdAHIkco4E
Gold History in the United States
In 1792, the newly formed United States Government passed a Mint and Coinage Act establishing a fixed price for gold in terms of U.S. Dollars. From that point on, gold and silver were officially legal tender in the country.
At the time, the US Mint bought and sold bullion at the rate of 1 part of gold for 15 parts of silver. Hence, the gold-silver ratio rarely varied much over a long duration of time.
In the 1800s, the United States saw a Gold Rush in California that drove inflation through the roofs. After failing to pay off their debts in gold and silver after the Civil War, the country passed the Coinage Act of 1873, ending the fixed-rate silver system. Arguably, world silver prices have been systematically suppressed by price discovery mechanics ever since.
Fast-forward to the 20th century. The United States government saw itself again in a financial crisis with the potential collapse of Wall Street. In an attempt to save the economy and then fight the deflationary spiral by spurring inflation. In 1933, then-President Franklin D. Roosevelt signed Executive Order 6102, eliminating the supposed sanctity of private contracts by repealing gold clause payments and even ordering the confiscation of private gold holdings in exchange for paper currency.
Private US citizens got banned from owning more than a few ounces of gold bullion valued at over USD $100 from 1933-1974 (less than three troy ounces for most of those four decades). In 1934, the US dollar lost nearly 70% of its purchasing power versus gold by the stroke of a pen and US Executive fiat decree.
#Gold Standard
— James Anderson (@jameshenryand) January 26, 2018
on #Jeopardy
Season 2018
Episode 18
The fun really gets underway at $800 & $1000 USD
6 min in,
my notes in
comments
as well: https://t.co/xoPwMH3HRi #bullion #silver pic.twitter.com/W4FlHSYsbM
Once the United States ‘temporarily repealed’ foreign government trading partners from redeeming US Gold Reserves with US dollars. And given that the US dollar remains the backstop of the monetary system, the world has been essentially running a total fiat currency monetary regime since August 15, 1971.
By 1974, then-President Gerald Ford repealed the limitation on private gold ownership. US citizens could again own gold bullion without restrictions beginning in 1975 privately (by then fiat $USD price of gold had run more than five multiplied at $185 per ounce after it had only started that decade priced near $35 per ounce beginning the 1970s).
![]()
Want More Gold Price History? Check our Gold Price History page that covers the Daily Spot Price of Gold Since 1968.
Here we cover the Top 10 most volatile gold price fluctuations since 1970. Most of the most significant moves happened after COMEX gold futures trading began dominating gold spot price discovery in 1975 and still running in 2022.
This gold spot price data also covers this entire full fiat currency era monetary regime ongoing (1971-2021) following the failure of the last central gold price-fixing cartel (London Gold Pool) by overwhelming free market physical bullion demand.
There is a case to be made now in early 2022. The potential of another run on physical gold bullion may perhaps cause another exponential melt-up ahead from arguably suppressed gold valuations at present.
Top 10 Gold Price Market Moves - Smallest to Largest
#10) +18.3% in June, 1973
On June 5, 1973, gold ran upwards for six trading days in a row. It gained +18.3%, briefly eclipsing $125 per ounce, having started that year’s price at nearly half that level.
Gold price bullishness was spurred on that year by overnight -10% fiat Federal Reserve note devaluations worldwide. Many international US travelers were refused when trying to exchange fiat US dollars abroad, given the waning confidence in purchasing power volatility back then.
#9) +19.5% in September, 1982
By September 8, 1982, gold enjoyed a four-day in a row run, adding +19.5% to its then spot price. Starting the month at near $400 per ounce, it blew beyond $500 per ounce in the following month of October 1982.
Below is a tweet thread showing various colorful characters trading in COMEX gold pits back in the early 1980s. The clip’s main character, Charlie Federbush, a former COMEX board member and Vice-Chairman, was indicted for conspiracy and commodities fraud by 1991.
1)
— James Anderson (@jameshenryand) February 28, 2021
Before the #COMEX
went full HFT digitard,
There were psychos in the trading pits
Here is 1981 coverage of but one
in a new #Gold #Silver #Bullion bear mkt
--https://t.co/V2F6uPxP5Uhttps://t.co/l2dIppuj7V pic.twitter.com/mW1oFFLmca
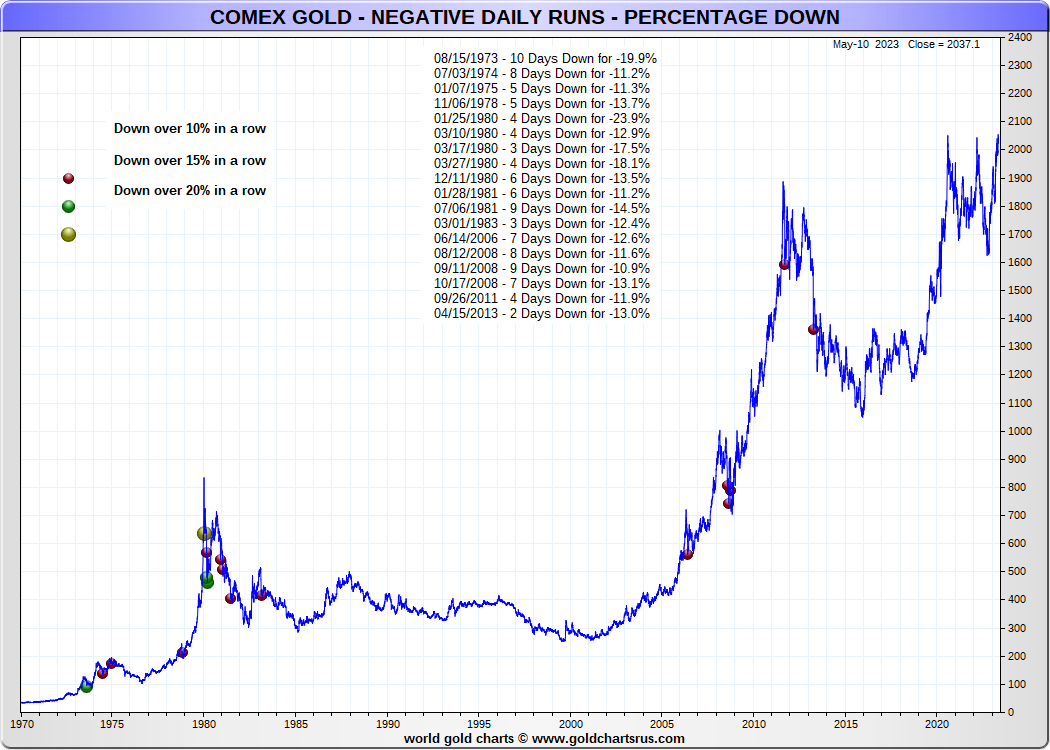
#8) -19.9% in August, 1973
Once arriving on August 15, 1973, after having nearly doubled in price for the first half of the year, the spot gold price fell off a cliff in early August to the tune of ten days of losses in a row. It lost -19.9% in a short timeframe.
Further overnight fiat US dollar devaluation fears kept gold spot price volatility strong the entire year of 1973 (https://sdbullion.com/gold-prices-1973).
#7) +20.8% in September, 1999
On September 28, 1999, gold went on a six-day trading tear. It gained +20.8% after the European Central Bank announced annual gold bullion sale limits and lending drawdowns. Gold ran in 1999 from a price low of around $250 an per ounce to a high of over $335 as the world faced Y2K fears of computer failures heading into the new millennium only mere months away.
#6) +21.5% in February, 1974
By February 26, 1974, gold, after beginning the year around $116 an per ounce, the gold spot price ran into the end of February to near $175. Bulls of gold bullion enjoyed an eight-day in a row positive gain of +21.5% near the end of that winter trading season.
In late 1974, US Treasury cables document that COMEX gold futures trading was set to be outsized in derivative trading volumes versus the then physical gold bullion spot market. This increased leveraging injected increased volatility into gold price discovery during trading days.
Assisted by excessive derivative gold futures contracts, the new gold bullion price discovery mechanics likely helped cut the gold price in half by August 1976.
The motivation in late 1974 by the then US Treasury heads was likely to dissuade US citizens from saving gold bullion over fiat Federal Reserve notes (i.e., US dollar or fiat $USD), given the ‘relegalization’ of private gold bullion ownership at the start of 1975.
#Wikileaks 1974 Fractional reserve FUTUREs EXCHANGEs
— James Anderson (@jameshenryand) January 2, 2017
help deter public's physical #Bullion demand.
See section #4 ➤https://t.co/oJuVZUFLXO pic.twitter.com/3XAapa6OT7

- Biggest Increases in Gold Prices 1970-2023 -
#5) +21.7% in May 1973
By the middle of May 15, 1973, the spot price of gold ran upwards for six days straight, gaining +21.7% over that small timeframe. Gold started the year priced around $65 per ounce.
The gold spot price nearly doubled intra-year 1973 with overnight fiat Federal Reserve note currency devaluations of -10%. Fears of that becoming more commonplace kicked off in earnest.
#4) -23.9% in January 1980
Having just recently reached a record gold price only days prior, by January 25, 1980, gold prices fell sharply over a four-day trading stop-loss cascade.
This came right after commodity futures exchange authorities shut down any additional long bets in COMEX silver futures trading pits four days prior. By only allowing liquidation orders in silver futures, it appears the gold futures trading pit got margin called, resulting in a -23.9% loss in gold in only four days of consecutive trading days.
#3) +28,8% in August, 1982
By August 26, 1982, the spot gold price ran nine days upwards in a row. It climbed +28.8% as the fiat Federal Reserve note lost purchasing power abroad.
This reportedly occurred partly because of speculation that the fiat Federal Reserve would further reduce its discount rate on bank borrowings from the Fed. In the summer of 1982, gold prices ran from a low of below three hundred per troy ounce to over five hundred per troy ounce by the first week of September 1982.
5)
— James Anderson (@jameshenryand) February 28, 2021
"Trading Places" explaining the
basics of high volume COMEX
commodity paper trading
[ perhaps the best 4th wall break on the BLT comment, and too the punchline at 1:21, although remember the likes of Duke & Duke are always loyal to their bankster brethren ] pic.twitter.com/MskanoliaY
#2) +32.1% in January, 1980
On January 7, 1980, gold prices had positive gains ten days in a row, +32.1%, touching above $660 per ounce. It had recently been priced below four hundred eighty-six per troy ounce in fiat $USD the then-recent Christmas holiday in late 1979. Following this, nearly the entire decade of the 1980s would undergo a gold mining bull market the world over.
#GOLDfever post-January 1980 Price Peak
— James Anderson (@jameshenryand) February 2, 2021
(1 of 4 thread)
CBOT below
Silver Trading pit | Serra Pelada, Brazil pic.twitter.com/kQK4ajXUxs
#1) +38.3% in January, 1980
Then record gold price on January 21, 1980, was reached by positive gains seven days up in a row, +38.3% culminating in a then-record spot price for gold above $850 per ounce..
With this run on the price of gold denominated in the fiat Federal Reserve note, the USA could have theoretically gone back on 100% to a 40% gold standard for most of the 1980s had we so chosen.
Now, looking backward at our collective actions and economic policy choices since. It appears we instead fiat financialized our economy (increasingly so in the 1980s) and outspent our then Cold War adversaries to systematic national regime failures.
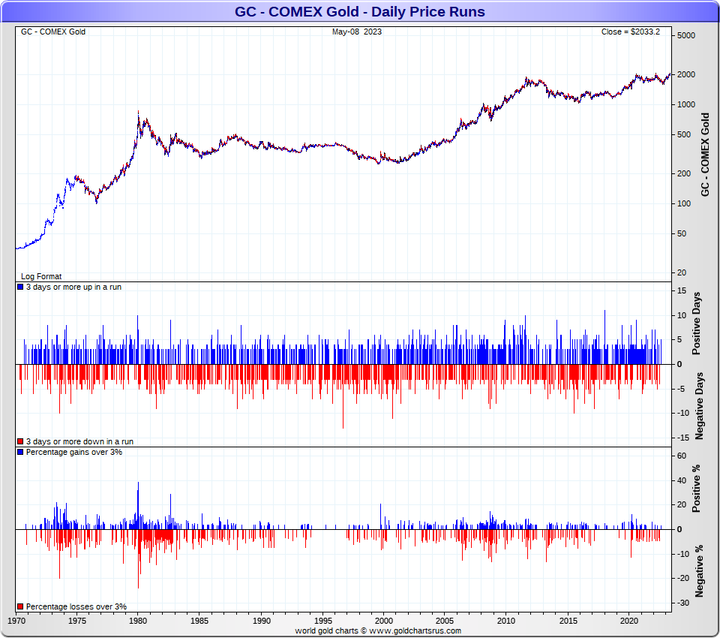
Biggest Daily Gold Price Movements Up & Down 1970-2023
Purchase Gold Bullion at SD Bullion
Enjoy saving the most popular bullion coins, such as the American Gold Eagle and the Canadian Gold Maple Leafs at SD Bullion, priced at the lowest premiums over the spot price of gold. Check out what other gold coins and gold bars we have in stock for you.
If you want assistance from our sales staff, reach out to us at 1(800)-8732, or through our live web chat feature. If you prefer, you can send us an email at sales@sdbullion.com.
If you liked this content, share it with your friends so they can learn and enjoy it too.