

If we have genuinely bothered to look at historical data, and our history, when considering our potential financial futures.
We really cannot say, we did not get warned about the possibility of losing another swath of fiat US dollar purchasing power to gold bullion in the coming decade(s).
Even with a quick cursory look back at Gold Price History, we find it replete with hard lessons many unfortunates will have to relearn in many of the most difficult ways.
Here you can find some interesting US dollar inflation charts below, often using the ultimate accounter of fiat currency, gold bullion as the bedrock numeraire.
In US history, rising gold bullion values have accounted for either unsound fiscal policies and or fiat currency flameouts. You can look back during eras of Revolutionary Wars, our Civil War, following WW1 into FDR's gold bullion confiscation, and then following Nixon's full fiat Federal Reserve note rollover 1971-1980.
Our multi-hundred trillion US fiscal policy and underfunded pension promise pile, only appears to be getting more unsound by the year. Many investors are going to have to pay dearly, so who might they be?
How's it going to play out, this next go-round for Gold vs. dollar history?
Are going to see another duration (the late 1860s, 1934, 1980) in which how much gold the US officially has gets bid up to prices that fully account for the base monetary supply of US dollars issued and outstanding?
In other words, are going to again see gold dramatically rise in US dollar price and valuation terms?
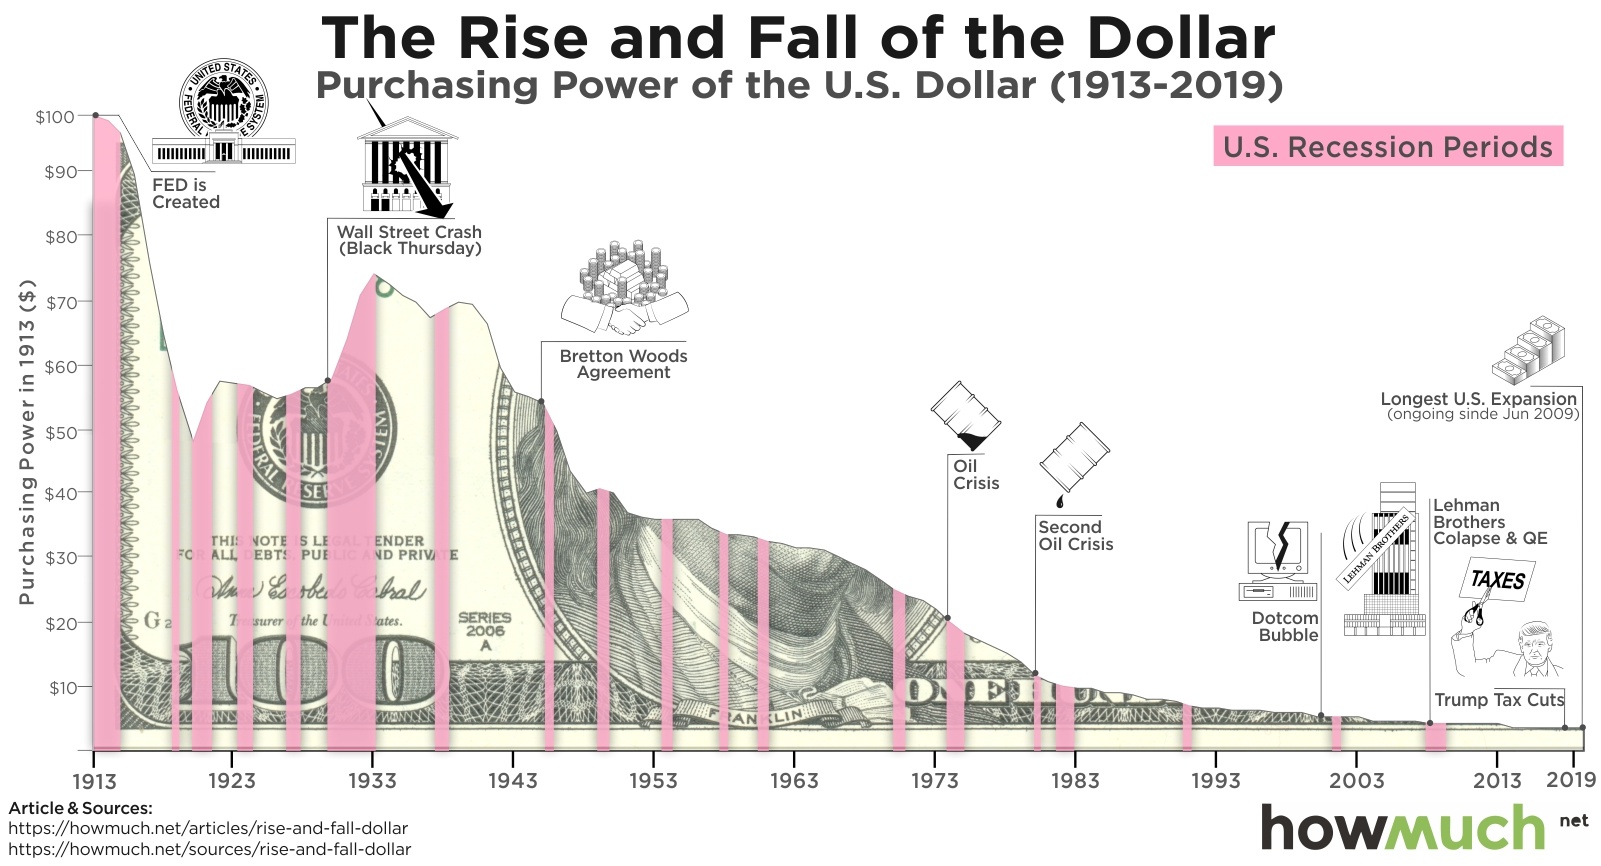
US dollar Inflation Chart
-
This US dollar inflation chart above shows the diminishing power of the fiat Federal Reserve notes also more generally known as the US dollar since 1913.
That was the year in which a central bank got enacted, unconstitutionally many would argue, here in the United States of America. Back then $100 US dollars could get you 4.87 troy ounces of gold bullion. Today it is using today's spot gold price when writing this in mid-2019. A $100 bill won't even get you 2 grams of gold bullion. That is a 98.6% devaluation in the US dollar's gold-bullion-buying-power since 1913.
Just pull a cash note out of your pocket (that is if you have yet to accept a cashless society), and read the top of the note's front or obverse face. That is the privately owned central bank which operates here in the USA and has gotten to 'legally' run its operations at the behest of our US Congress since 1913.
Their mandate is stable prices and full employment. In ours, and many other well-informed opinions, the Federal Reserve has consistently and historically failed on both these charges. They are, at best, incompetent, in other words.
Too, the fiat Federal Reserve note is probably one of the USA's most successful exports in our modern times. It remains the dominate fiat reserve currency of the world.
While at the same time, other competing government gold reserves are building (China gold holdings, Russian gold reserves, EU gold agreements, etc.) readying to move away from the fiat Federal Reserve note as the sole dominate numeraire or trade currency globally.
Tying the fiat Federal Reserve note into the world's massive petrol/oil trade and thus further ingraining it to global financial plumbing in the 1970s. Doing so has allowed us to extend our fading empire's duration in time.
-
-
Too, the US dollar's now fully fiat essence, has also helped hollow out our middle class and driven wealth disparity to dangerous levels both politically and sociologically speaking.
A significant problem with the US dollar inflation chart above is that it uses data from the government's own Bureau of Labor and Statistics (BLS), which has since 1980, been categorically misrepresenting actual price inflation using sleight of hand hedonic adjustments.
The powers that be tell us there is no price inflation and their favored media beat us over the head psychologically with this out of touch mantra. Anyone with a brain and average Joe experience should be able to deduce, that the prices for the real things that we need (e.g., housing, medical expenses, insurance coverage, education, childcare costs, etc.). Have only been rising in this 21st Century.
The real tell for fiat US dollar purchasing power loss is how it has performed vs. gold over the long term.
This is precisely why historically governments like to conspire from time to time in rigging gold's price at a fixed and or depressed price level (e.g., London Gold Pool collapse 1968, the now historic record 1974 attempt to dissuade US citizens from buying gold, etc.).
Eventually, market rigging forces lose way to real market forces, and a new fiat price for gold bullion establishes exorbitantly higher than beforehand.
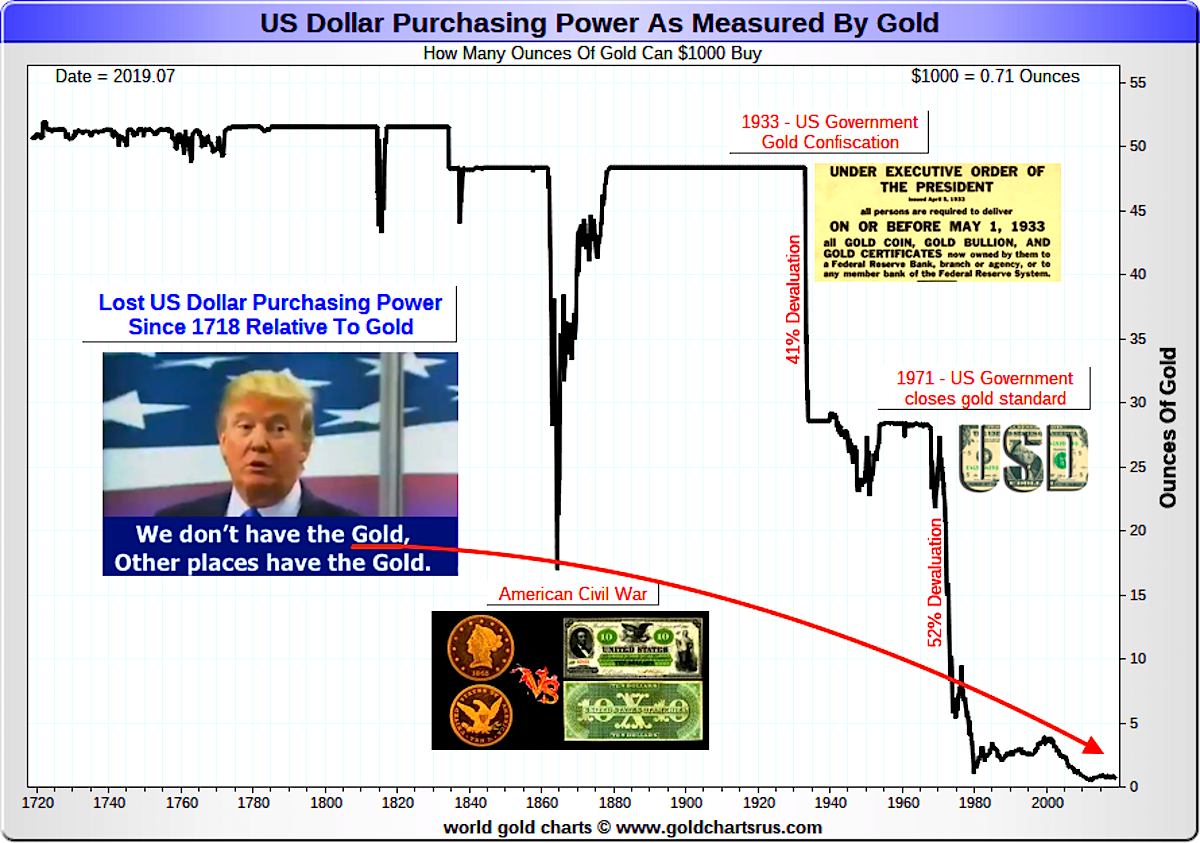
Take a look at our nation's history using how many troy ounces of gold bullion that $1000 US dollars can buy.
-
Gold vs. Dollar Historical Chart
-
The chart begins with pre and post-Revolutionary War purchasing power volatility.
There were many colonial currency crises then and even hyperinflations resulting from unbacked fiat promissory note flameouts. The dismissive expression, 'not worth a continental' originates from that era.
We have written about the Gold dollar vs. Greenback monetary experiences of the Civil War era. As well, the 1933-1934 gold confiscation is something even nerds trying to answer Gold Standard trivia on Jeopardy fail.
And of course, in 1971 when Nixon moved us off the final ties to gold bullion discipline, helping to lead to the mega bull market in precious metals peaking by 1980.
Given that the English word 'dollar' derives its origin as a silver coin from a silver mine. We lost those principled silver dollar coins in 1964 collectively as a nation.
We should be clear about the chart above.
The trend of these gold related and other silver vs. dollar price-related charts are obvious too.
The fiat Federal Reserve note will continue losing purchasing power to gold bullion and other precious real assets as time moves forward. Only a structural monetary reset can potentially bring back some soundness to our money.
We are going to continue betting that will not happen anytime soon.
-
Gold vs Dollars: A Potential Average Joe's Trade 2020s
-
The same loss of purchasing power to gold statements can be said for all fiat currencies vs. bullion and likely almost all private/government cryptocurrencies too.
Every currency substitute humanity makes merely a stand-in or proxy for precious metal money. All currency derivatives eventually default and become worthless (rare monetary collectibility or historic museum note pieces perhaps withstanding). The central banks of central banks show this point well with their money flower illustration.
Hence having a long term prudent bullion position (the math and data prove it out). Especially now to hedge oneself again further US dollar devaluations makes common sense.
Even our nation's leader admitted in 2016, before winning the Office of the President of the United States.
Other places have gold.
-
-
— James Henry Anderson (@jameshenryand) March 22, 2016
⬇#Trump hints no #Gold in #FortKnox⬇
At 17:40 source -> https://t.co/5np85AUkLj
HT @Smaulgld & @TFMetals, #China pic.twitter.com/JZCgIbEmh4
-
Historically, when other places or people have 'the gold.'
The poorly defined current US dollar, and more specifically now the current fully fiat Federal Reserve note.
It stands to once again, to lose tremendous purchasing power to gold bullion (e.g., go back to the chart above and relook closely at timeframes, 1970-1980, 2000-2011, 2016-20??).
-
US dollar Gold Standard vs. Fiat Currency Chart
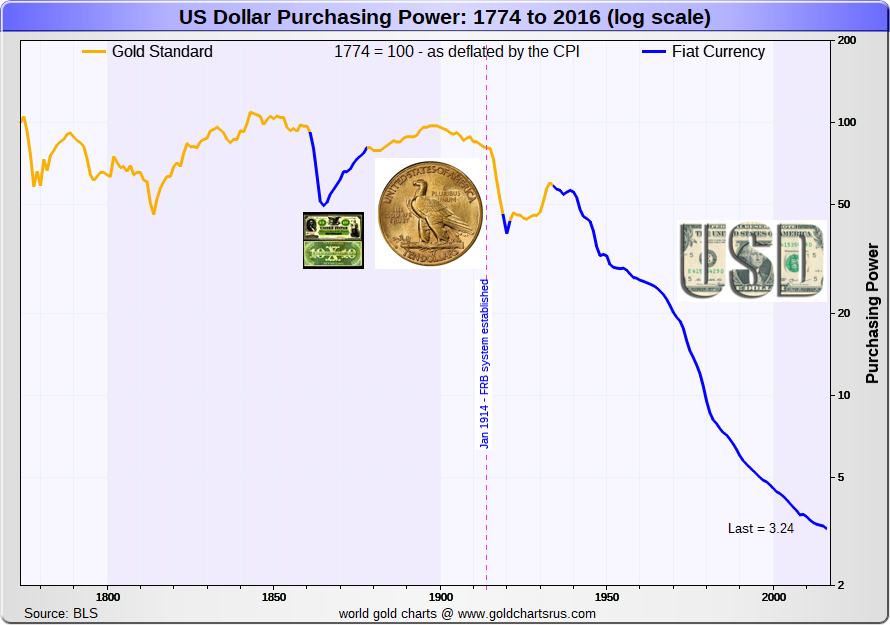
What about a future Gold Standard in the USA?
-
To learn best practices to acquire and buy bullion safely, and also eventually perhaps to sell bullion, pick up our free SD Bullion Guide before you go.
Thanks for visiting us here at SD Bullion.
***


