

Gold Silver Ratio Chart
Live Gold to Silver Ratio Today's Chart, Historical Gold vs Silver
The Gold Silver Ratio is by far the most watched relative ratio measurement in precious metals investing. Scroll down to see live Gold Silver Ratio as well as longterm charts of Gold to Silver Ratio history.


Top Selling Bullion Products
Share our original content for free using these guidelines:
– Please link back to the original source here
– Please provide attribution to “SD Bullion”
Live Gold Silver Ratio Charts, Historical Gold vs Silver
The Gold Silver Ratio is by far the most watched relative ratio measurement in precious metals investing. Essentially, it is an index that fluctuates based on gold and silver prices. Scroll down to see the live Gold Silver Ratio as well as long-term charts of Gold Silver Ratio history.
Let us begin this analysis with a clear explanation of what the Gold-Silver Ratio is.
Gold Silver Ratio - (n) the dynamic moving amount of silver one can theoretically buy with a fixed amount of gold. Typically, in the Western world, the gold-to-silver ratio is measured in the number of troy ounces of silver one can acquire with one troy ounce of physical gold. Although it can also be estimated in equivalent sizes of bullion weights: grams, kilos, tonnes, etc.
Many modern-day gold and silver bullion buyers and traders use the fluctuating Gold Silver Ratio to determine which precious metal may be poised to outperform the other.
For example, we will examine times the Gold-Silver Ratio has fallen above or below its 20th and 21st Century averages, or longer, which will show you in various longer-term Gold-Silver Ratio charts below.
Depending on their outlook, time horizons, and beliefs, physical precious metal savers may want to buy more gold or more silver, depending on whichever may appear to be more undervalued to the other.
Regarding geologists, we find roughly 8 parts of silver to 1 part gold in the ground. Silver and gold's historic monetary ratio has typically averaged around 16, and has little, if anything, to do with how they are valued today. Remember that silver has been divorced from the modern financial system since 1964
Only produced by star explosions, the lack of a precious supply of both physical silver and gold bullion is one significant attribute to its enduring value. There are, of course, many trillions of other reasons the world saves silver and gold for wealth preservation and even appreciation at the right timeframes.
Extreme privacy between the two bullion types is just one additional attribute they both share.
Gold Silver Ratio Volatility
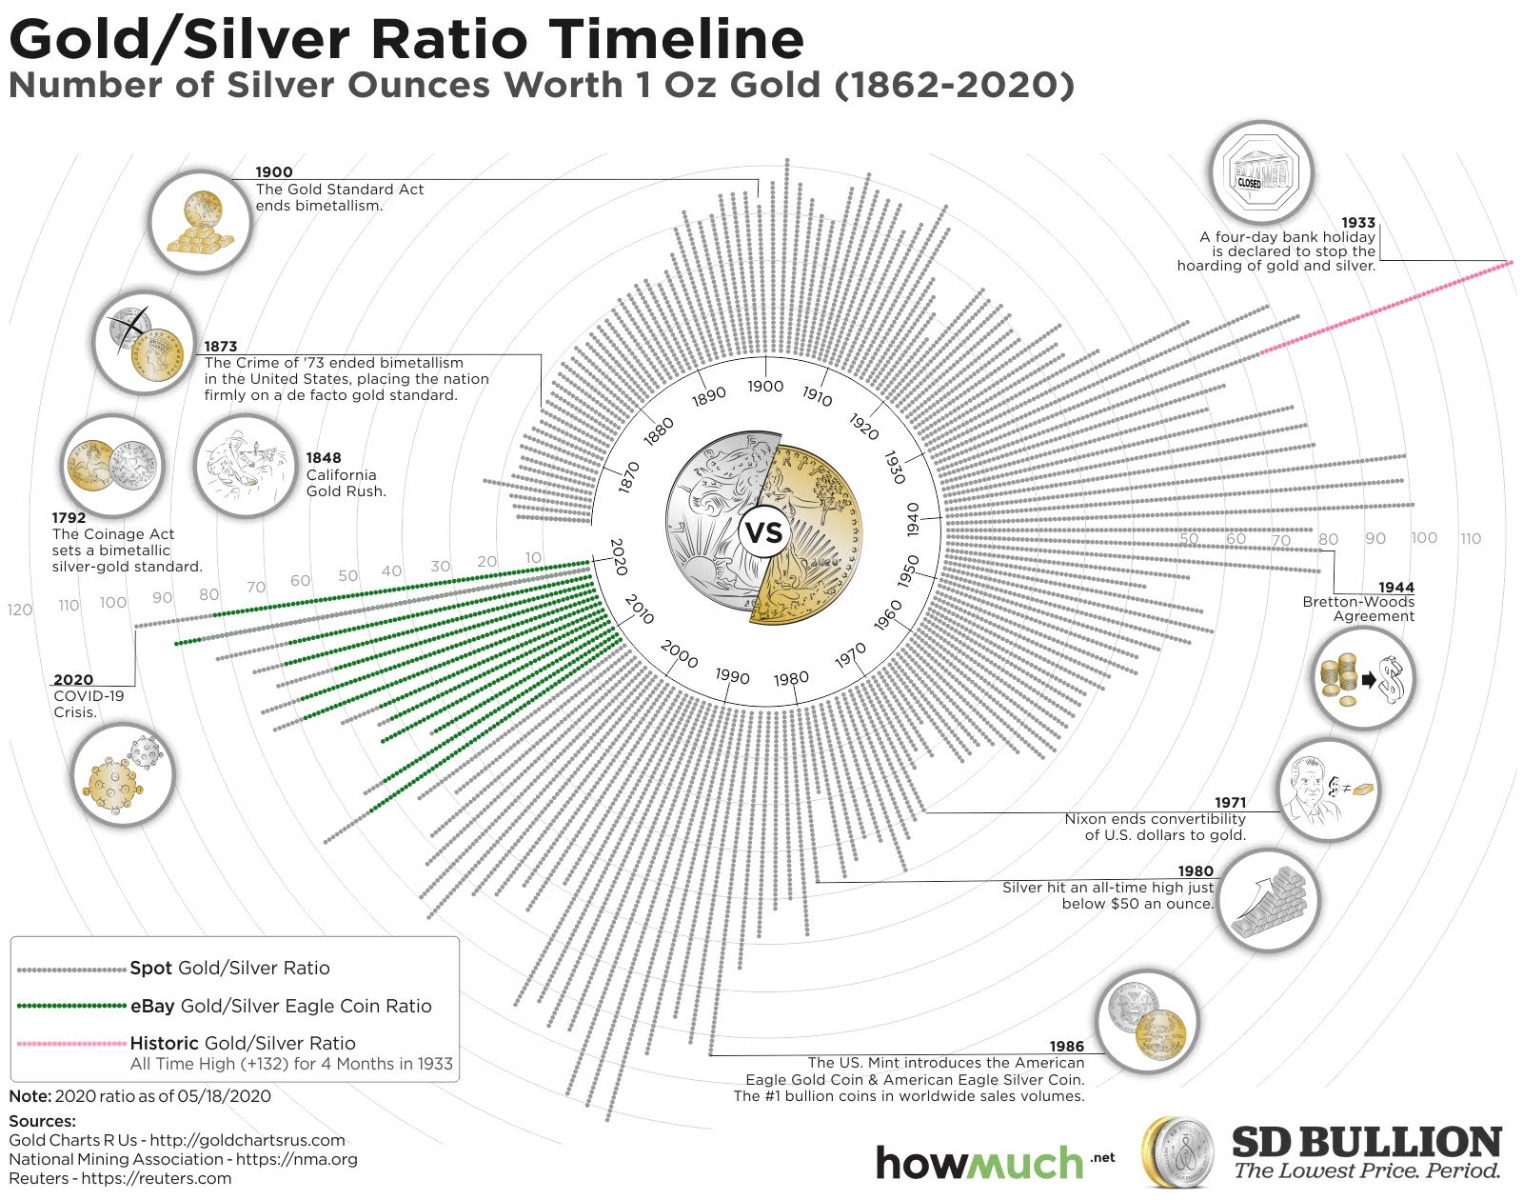
The Gold-Silver Ratio has varied widely through different places and different times. Even in ancient times, it played an essential role in shaping the economy of various societies. One relevant instance in documented history is that the Roman Empire officially set the ratio at 12:1. Centuries later, the U.S. government fixed the ratio at 15:1 with the Coinage Act of 1792.
You can check the modern-day gold-silver ratio in our interactive chart above.
In bullion bull markets, gold often tends to outperform silver in the beginning acquisition phases. Silver historically plays catch-up and outperforms gold in a more speculative environment, when the average 'man on the street' and even high net worth investors begin choosing silver bullion over gold bullion allocations.
Industrial demand also plays a significant role in deciding silver prices. Silver has an incredible variety of technological applications, and prices usually rise when the industry is in high production.
Gold serves primarily as a security asset, a hedge against economic instability, devaluation, deflation, and currency replacement.
Look back at the bull markets of both 1980 and 2011 for illustrations of these stated facts. And no older-timers, it was not merely the scapegoated Hunt Brothers silver speculations that caused virtually all commodities to multiply in US dollar values many-fold throughout the 1970s.
When silver performs best versus gold in recent history, it is often during timeframes in which fiat currencies and their enduring values are most acutely called into question by the investing masses. Many bullion buyers, including ourselves, believe another era of fiat currency faith loss will come to fruition soon enough.
Over the last few centuries, the Gold-Silver Ratio has been fixed by authoritative government decree, their central banks (e.g., Bank of England, Federal Reserve), or even heavily influenced by commodity futures contract price discovery markets (e.g., from 1974 to today's version of the CME Group's COMEX).
The Gold-Silver Ratio has been as low as 2.5 oz of silver to acquire 1 oz of gold (ancient Egypt). The Gold-Silver Ratio has gotten as high as over 100 oz of silver to buy 1 oz of gold in the 1930s as the US government forced US citizens to turn in their gold coin savings.
The following chart covers the past 300 years of the Gold-Silver Ratio.
Gold Silver Ratio 300-Year Chart
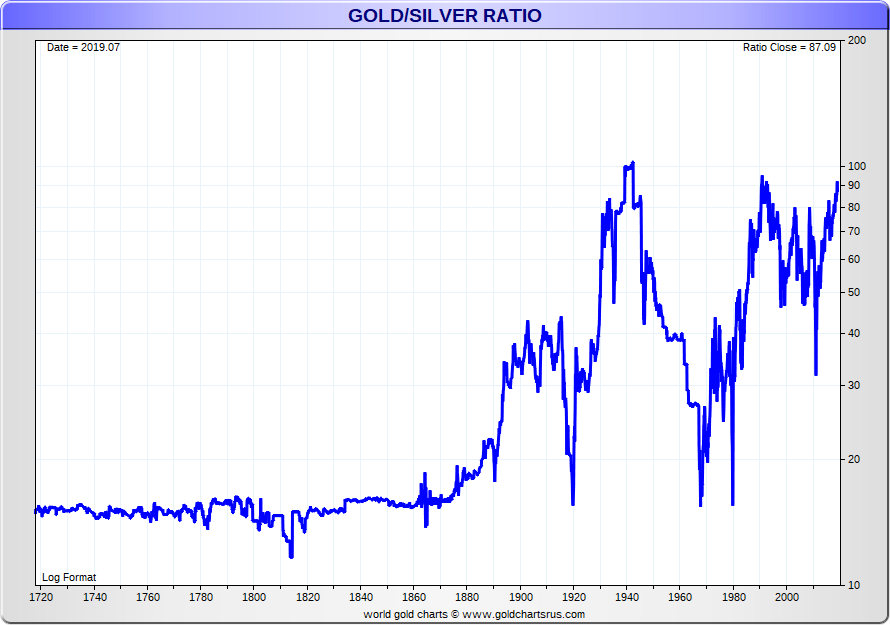
What happened with the Gold-Silver Ratio following the US Civil War?
What happened with the Gold-Silver Ratio following the confiscation of US citizens' private Gold and Silver (1933 / 1934)?
Gold Silver Ratio 70 Year Chart
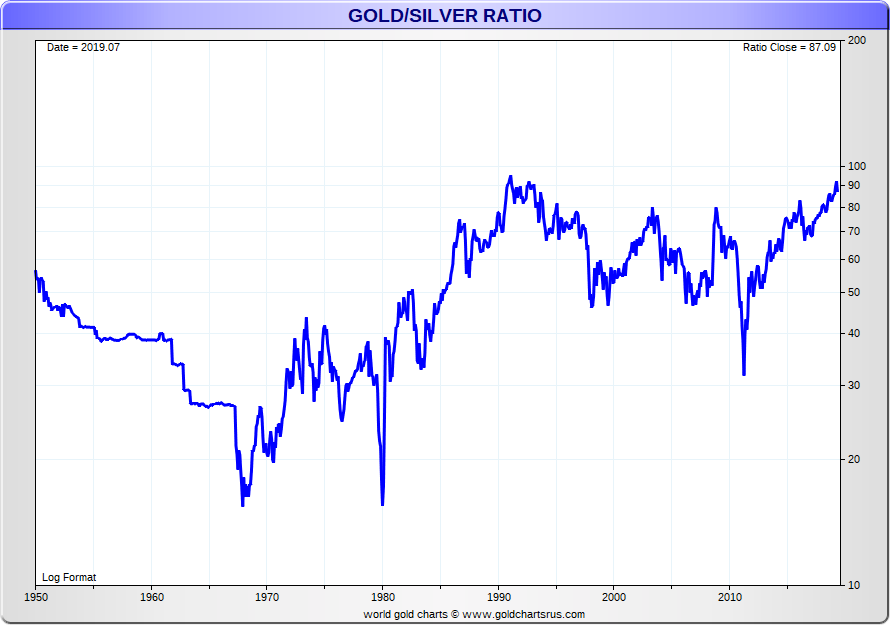
What caused the lows in the Gold-Silver Ratio in the years leading into 1968, in early 1980, beginning in 2010 and into the year 2011 respectively?
Here at SD Bullion, you can learn more about the fundamental investment factors for gold and silver investing.
Given the way both the silver spot price and gold spot price are mainly discovered by dominating synthetic derivatives at this moment in time, it is not until lessening supplies vs. increased demand factors exacerbate that we often historically see the Gold Silver Ratio drop sharply.
The last significant example of this was from 2009 to the 2011 timeframe, in which physical bullion buying at the margin forced the Gold Silver Ratio sharply downwards, reaching levels as low as 32 or 3,3, depending on the derivatives one uses to measure by.
Of course, one doesn't have to look far to find what may sound like ridiculous gold price predictions. Often, many are arithmetically based on historical US dollar monetary base outstanding precedent. Every 50 years or so, the outstanding US dollar issuance is accounted for by the official US gold reserves. We believe we are on track for another historic beating of the nation's fiat currency, i.e, the US dollar, by gold in the 2020s.
If, for example, the spot price of gold were to hit $5,000 oz USD and the Gold-Silver Ratio tightened to its multi-millennia and naturally occurring near the ground averages, the world could simultaneously have silver spot prices well above $100 oz USD.
The following logarithmic format chart has possible projections for future Gold Silver Ratios moving into the 2020s.
The yellow line tracks the ongoing fiat US dollar price of gold in this 21st-century bullion bull market (see left axis).
The red line tracks the ongoing Gold Silver Ratio in this 21st Century bullion bull market (see right axis, used for both the continuing ratio and the US dollar silver price).
The gray-colored line tracks the ongoing fiat US dollar price of silver in this 21st-century bullion bull market (again see the right axis).
The following logarithmic format chart has possible projections for future Gold Silver Ratio potentials moving into the 2020s.
Gold Silver Ratio Potential Future Chart
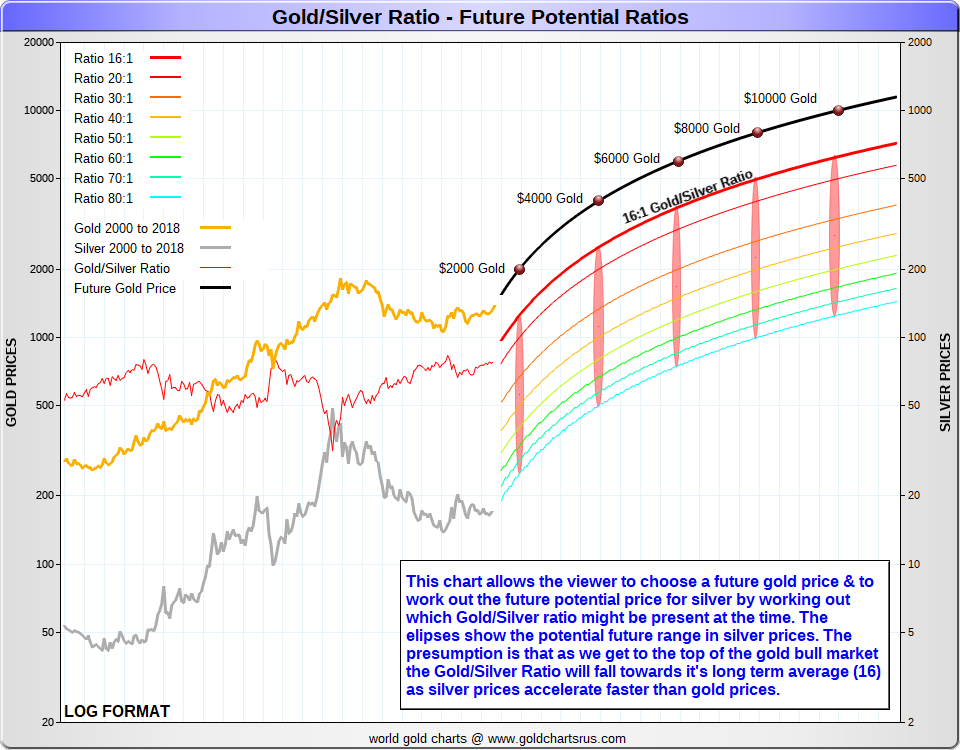
Logarithmic scale charts like the above are nonlinear scales often used when there is a broad range of quantities, like we have for various potential Gold Silver Ratio levels ahead.
This chart is scaled, so the same vertical distance represents the two equivalent percent changes on the table (e.g., $50 oz to $100 oz silver vs. $100 oz to $200 oz silver both represent 100% increases, thus they take up the same amount of space on the chart).
Many bullion buyers today fully expect gold and silver bullion (e.g., gold and silver coins and bars) to continue their 21st Century Bull Markets and possibly each respectively reach five and triple-digit fiat US dollar values per troy ounce within the coming decades.
Click here to learn more about the 5,000-year Gold Silver Ratio history. Learn how ridiculously low the Gold Silver Ratio was before the industrial revolution made mining for most often by-product silver, more accessible now than it was in the long-dated past.
We have also written about the Gold-Silver Ratio in general, including a practical guide to how some gold and silver bullion buyers and investors use it when buying their bullion.
How is the ratio calculated?
The gold-silver ratio is calculated by dividing the current gold price by the current silver price. For example, if gold is $2,000 per ounce and silver is $25 per ounce, the ratio is 80. This means it takes 80 ounces of silver to equal the value of one ounce of gold, a useful metric for evaluating silver investments and the silver market overall.Why does the gold-silver ratio matter to investors and traders?
The ratio helps investors and those trading precious metals assess relative value. A high ratio may signal silver is undervalued, encouraging investors to purchase silver. A low ratio may suggest gold is the better buy. This tool assists in timing decisions to buy gold or silver and helps manage risk within a diversified portfolio that may also include assets like stocks.What does a high ratio historically signal?
A high gold-silver ratio often signals that silver is cheap compared to gold. Historically, this has preceded periods when silver investments tend to outperform gold in terms of percentage gains. According to historical data, such trends can attract traders looking to take advantage of silver’s upside potential within the broader silver market.
What does a low ratio historically signal?
A low gold-silver ratio typically suggests gold is undervalued compared to silver. In this scenario, silver may have appreciated significantly due to industrial applications or investor demand, making it more expensive compared to one ounce of gold. Investors might see this as an opportunity to buy gold as a more affordable hedge.
Does the ratio predict future prices?
Not directly. While the gold-silver ratio reflects relative pricing, it doesn’t predict specific future prices for either metal. Investors should consider it alongside other tools—like historical data, trends in the current silver price, and broader economic indicators—when evaluating precious metals and silver investments.
How often is the chart updated on this page?
The gold-silver ratio chart is updated on a daily basis using the most recent spot prices for both metals. This ensures you get a timely and fairly steady snapshot of how one ounce of gold compares in value to a single ounce of silver in the current silver market.
What macro factors move the gold-silver ratio?
The ratio is influenced by a range of macroeconomic forces, including inflation expectations, interest rates, and global economic risk. Demand for silver’s industrial applications, along with central banks and governments seeking monetary stability, also play a role. Investor sentiment toward safe-haven assets like gold and silver further affects the ratio.
Are there limits to relying on the gold-silver ratio?
Yes. The ratio doesn’t fully reflect differences in supply and demand or the industrial applications that heavily influence the current silver price. While it's a useful trading tool, it shouldn’t replace a broader investment strategy that accounts for market trends, silver investments, and the purchase behavior of metals alongside other assets like stocks.