


First, let us begin this analysis with an explanation of what the gold-silver ratio is.
Gold Silver Ratio Definition
Gold Silver Ratio - (n) a moving measurement of the amount of silver one can buy with a fixed amount of gold. Typically in the western world, the gold to silver ratio is measured by simply dividing the gold spot price by the silver spot price. It has ranged from 2.5 to 100 in recorded history.
Why does the Gold Silver Ratio matter?
Many present-day gold silver buyers and traders use the gold-silver ratio to determine which precious metal looks poised to outperform the other. For example, is the gold-silver ratio has fallen above or below its 20th-century average, precious metal investors may want to buy the one which appears to be undervalued to the other.
To begin we will go way back in time to see the variance of all-time gold-silver ratio low of 2.5. Then we swing back to the respectively recent all-time gold-silver ratio high of 100.
As of producing this content, the gold-silver ratio has risen above 80.
Historic Gold Silver Ratio - Gold vs Silver Ratio History
The following content and historic data are directly sourced from the book called ‘Silver Bonanza’ and it was authored by James Blanchard III released in 1995. Well worth picking up a used copy for any long term silver bullion buyers.
Mr. Blanchard was a successful businessman and the driving force behind the ‘re-legalization’ of private gold ownership in the USA in 1975. Only recently have we learned through Wikileaks intercepted US cables that simultaneous efforts were ongoing to discourage US citizenry from buying and saving gold bullion long term (but that is a COMEX and gold price discovery topic for another post).
Below is nearly 5,000 years of gold-silver ratio data:
The more ancient ratios are estimates for long periods of time. Those from 1600 to 1900 (AD) are yearly on periodic averages from Michael G. Mulhall, The Dictionary of Statistics, 4th ed. (London: George Routledge and Sons, 1899) and E.J. Farmer, The Conspiracy Against Silver, or a Plea for Bimetallism (New York: Greenwood Press, 1969; originally published 1886), p. 13.
The other statistics are from Steve Puetz’s Investment Letter, or from our own records. Statistics after 1900 are not yearly averages, but lows or highs that generally did not obtain for long periods. In 1980 the ratio stayed below 20 to 1 for the first two and a half months only and touched under 16 to 1 for only a few days in January.
|
TIME FRAME / ERA |
Sell 1 oz Gold Bullion |
To buy X oz of Silver |
|
Menes, Egypt 3200 BC |
1 |
2.5 |
|
Egypt, 2700 BC |
1 |
9 |
|
Hammurabi, Mesopotamia 2700 BC |
1 |
6 |
|
Egypt 1000 BC |
1 |
10.0 |
|
Croesus, Lydia 550 BC |
1 |
13.33 |
|
Persia under Darius, son of Hystaspes (father of Xerxes) |
1 |
13.0 |
|
Plato, ca. 445 BC |
1 |
12.0 |
|
Xenophon (in Persia) |
1 |
11.66 |
|
Menander, ca. 341 BC |
1 |
10.0 |
|
Greece, ca. 300 BC |
1 |
10.0 |
|
Rome, 207 BC |
1 |
14.5 |
|
Rome, 189 BC |
1 |
10.0 |
|
Rome, 40 BC, Julius Caesar |
1 |
7.5 |
|
Rome, Claudius |
1 |
12.5 |
|
Constantine the Great |
1 |
10.5 |
|
Theodosian Code |
1 |
14.4 |
|
Medieval England |
1 |
11.1 |
|
Medieval Italy |
1 |
12.6 |
|
TIME FRAME / ERA |
Sell 1 oz Gold Bullion |
To buy X oz of Silver |
|
Spain, 1497 AD, Edict of Medina |
1 |
10.07 |
|
Germany, 1500 AD |
1 |
10.05 |
|
1600 - 1620 AD |
1 |
12.1 |
|
1700 - 1720 AD |
1 |
15.1 |
|
1800 - 1820 AD |
1 |
15.3 |
|
1821 - 1840 AD |
1 |
15.6 |
|
1841 - 1860 AD |
1 |
15.6 |
|
1861 - 1870 AD |
1 |
15.6 |
|
1871 - 1880 AD |
1 |
16.7 |
|
1881 - 1882 AD |
1 |
17.6 |
|
1883 - 1884 AD |
1 |
18.4 |
|
1885 - 1886 AD |
1 |
19.9 |
|
1887 - 1888 AD |
1 |
21.2 |
|
1890 AD |
1 |
18.3 |
|
1932 AD |
1 |
75.0 |
|
1940 - 1941 AD |
1 |
100.0 |
|
1980 AD |
1 |
16.0 |
|
1991 AD (February) |
1 |
100.0 |
|
1994 AD (July) |
1 |
73.25 |
Gold Silver Ratio Long Term United Kingdom (UK) 700 years

Gold Silver Ratio Long Term Before and After USA 700 years

You will notice in the chart above that the gold-silver ratio in the USA is skewed likely due to starting with English price data and splicing to US price data. Using other gold-silver ratio sources for US price data we find that the gold-silver ratio in the United States has dipped into the teens on three occasions over the past 100 years (1919, 1968, 1980).
Gold Silver Ratio 100 Years USA

Over the past 100 years, the gold-silver ratio has averaged above 50, yet while this is true we are focusing on those brief points in time in which the gold-silver ratio dipped to periodic low points and the potentiality of that again occurring in the 2020s. Note 1919, 1968, 1980, and 2011 as evidence of this.
The chart below was published in a 1998 Forbes magazine showing gold-silver ratio from 1344 AD into the beginning of this 21st Century Gold Rush.
The article was published as a result of Warren Buffett’s Berkshire Hathaway 1997 / 1998 purchases of 129,710,000 ounces of silver bullion.
Within the following historic chart is an attempt to backdate the purchasing power of silver throughout over 650 years of time.
Next, we expand upon how silver production exploded after the industrial revolution (19th Century and beyond) yet is now reaching production limits given low silver prices vs difficulty finding new silver ore deposits.
All-Time Gold Silver Ratio High was in 1939

By the spring of 2006, Berkshire Hathaway announced having sold off their entire silver bullion position. Over this near 9 year timeframe, the price of silver more than doubled.
Interestingly the then record-sized Warren Buffett and Berkshire Hathaway’s silver sale announcement came at nearly the same time as the new silver ETF launch SLV on April 21, 2006. Its spring 2006 launch required a massive amount of silver bullion to begin the fund (130 million ounces estimated).

Many presume that Berkshire Hathaway's 1998 - 2006 silver bullion holdings held in London ended up being sold and used in the beginning formation of the Barclays Silver iShares Exchange Traded Fund (SLV).
21st Century Gold Silver Ratio 2000 - 2018
Writing this in early 2018 AD, the gold-silver ratio has again above risen above 80. Thus theoretically a person who possesses 1 ounce of gold bullion, could theoretically sell their single gold ounce and subsequently buy some 80 ounces of silver bullion.

Of course this theory does not take into account the risks nor costs associated with trading either electronic traded precious metal proxies (ETFs, derivatives can fail or become frozen) or even tax repercussions associated with swapping (not like-kind metals) but one specific physical precious metal for another (e.g. gold bullion for silver bullion, or silver bullion for gold bullion, etc.).

Gold Silver Ratio Now Live: Source
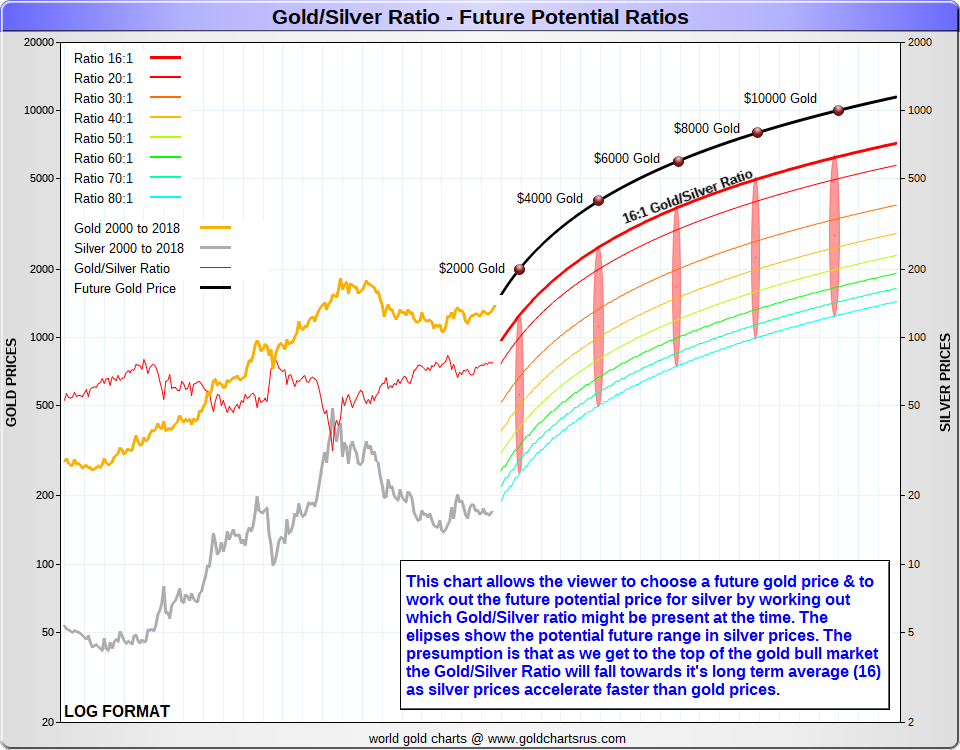
Potential Gold Silver Ratio Future Scenario Charts
Naysayers of the gold-silver ratio often point out that the past 100 years data, in which the gold-silver ratio has averaged above 50.
Yet while this is empirically true we are more concerned with those brief points in time in which the gold-silver ratio dipped to periodic low points (e.g., 1980 silver price high, and 2011 silver price spike).
We also wonder about the potentiality of another low gold-silver ratio spike occurring in the 2020s.
The following charts give gold and silver price and ratio potentiality ahead.
If you believe the price of gold will rise in the coming years, the following chart ellipses can help determine what the potential US dollar silver price could be per troy ounce.
By using various gold-silver ratio levels ranging from the current +80 ratio, past the 2011 peak of just above 30, all the way down to the multi-millennial average of 16.
Gold Silver Ratio Future? | Linear Chart Potential

Gold Silver Ratio Future? | Logarithmic Chart Potential
Finally, the following video can give you a backward-looking idea of how some bullion buyers suggest using the gold-silver ratio to buy or sell on or the other precious metal when ratio levels near peaks.
The theoretical results are obviously using backward-looking ‘cherry-picked’ data, thus the hypothetical results will be inflated. But the fundamental principle discussed may be sound in managing one’s bullion bedrock investment portfolio positions, as not having an allocation to bullion while living under global fiat currency regimes, is historically unwise and short-sighted.


