


The Dow Silver Ratio and Dow Gold Ratio can help investors broadly understand overall US stock market vs. silver bullion values using a historical perspective.
Here we will examine some long term Dow Silver Ratio charts but also where the value of silver may again peak someday. US stock values accordingly and concerning the past 1980 bullion bull market peak.
We will also cover the critical difference between the Dow (i.e., Dow Jones Industrial Average composite index, DJIA) versus more accurate and broader-based indexes such as the S&P 500.
To begin below is a 200 year Dow Silver Ratio chart. Note that before the year 1896, a surrogate index gets used for the DJIA Index data (1800 - 1895).
DOW SILVER RATIO CHART
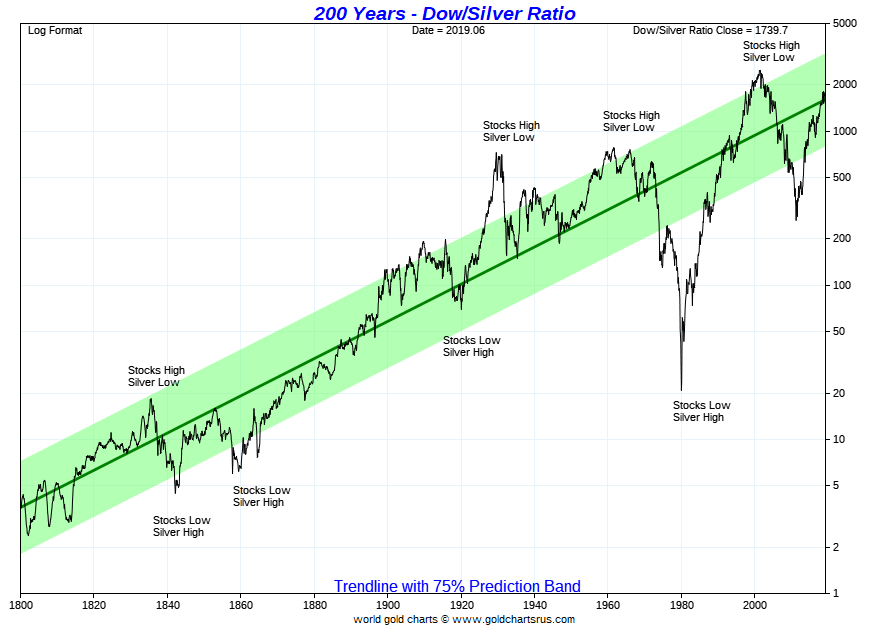
We can see that in the prior bullion bull market of 1980, the Dow Silver Ratio bottomed briefly around 20 oz of silver value to buy one share of the DJIA.
Currently, it takes over 1,700 oz of silver to buy one share of the Dow Jones Industrial Average index. If history were to repeat and silver outperformed the Dow in the coming years matching its 1980 ratio bottom of 20, that would mean an outperformance of silver vs. primary equity values of over 85 multiple.
Could that possibly reoccur? Perhaps so, but maybe not.
If one eyeballs the last 20 years or so on the chart, you can see the 2000 Dot Com stock bubble and subsequent 2008 crash, leading to QE123 programs, and $50 oz short squeeze in silver 2011. In silver terms today, perhaps all we are witnessing in near-record nominal price US stock market, is just a long term dead cat bounce of sorts measured by silver's price.
To produce such a shocking turn of value (i.e., significant US stock losses vs. silver bullion values), the financial world would most likely have to experience a real monetary crisis larger than even the scapegoated Hunt Brother’s 1980 version.
A global collapse in fiat currency confidence can certainly have extreme outcomes even if they are short-lived. The late 1970s and early 1980s are but one example of this point.
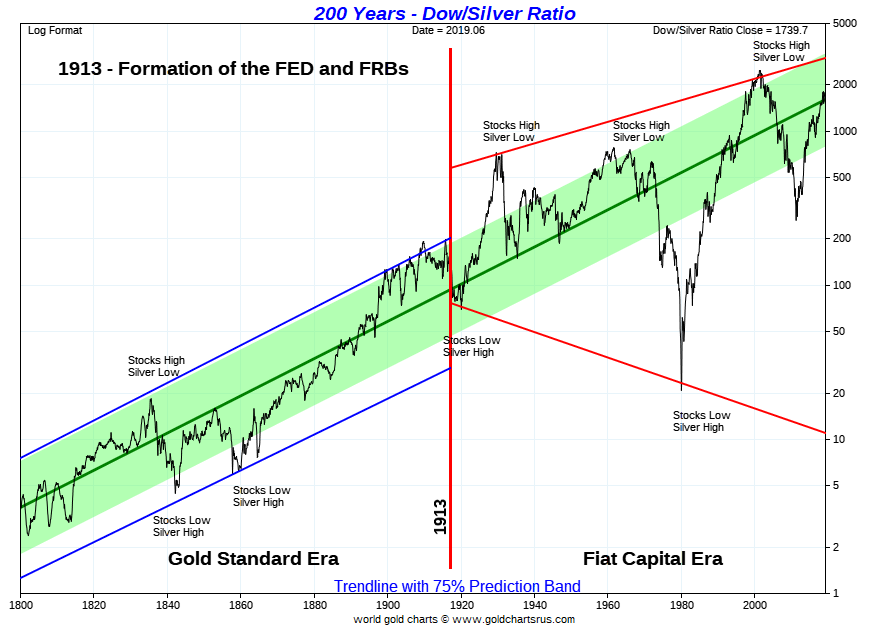
Next, we are going to dig further into this 200 year Dow Silver Ratio chart using addition lines to point out the involvement of the US private Federal Reserve central bank founded in 1913.
Their involvement in both setting silver values and monetary interest rates has exacerbated and produced ratio volatility. In other words, notice how wide-ranging both up and down the Dow Silver Ratio has swung from 1913 to today.
It is our firm belief and that of many other financial experts that the next rollover in this chart could produce the lowest Dow Silver Ratio ever witnessed in the modern economic era.
Of course, such a scenario would likely be the result of a silver price bubble with likely multi-hundred dollar an ounce silver and much lower significant nominal stock prices is the reason for such a low bottoming out of the Dow Silver Ratio ratio.
Dow Silver Ratio Chart: Central Banks Increase Volatility
Time will, of course, tell, of course.
But if one considers the baby boomer demographics at hand, ever-growing debt and unfunded liabilities, and burgeoning technological revolutions ongoing. Surprises and volatility are likely ahead for financial market values to come.
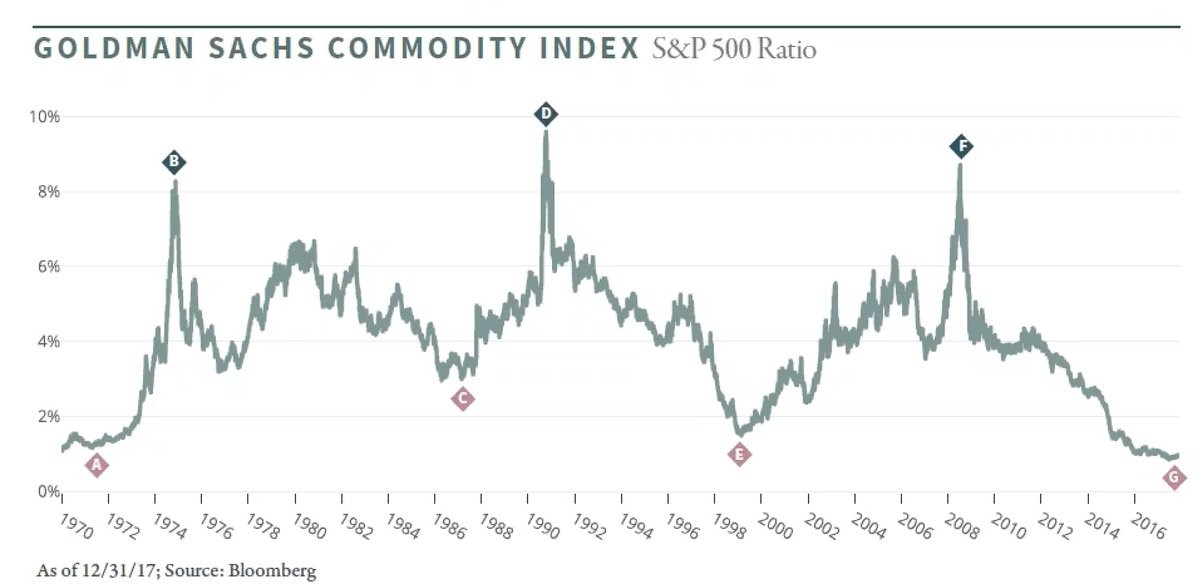
In this full fiat currency era, we have perhaps never seen composite commodity indexes as cheap as they are valued now versus US stock market index valuations.
Even precious commodities like silver bullion have not been this cheap vs. stocks, the year 2000's Dotcom bubble only outstanding.
Commodities are Historically Cheap vs. Stock Values
Of course, in investing, timing is critical. Always key to success is having a large swath of investors agree with you later, but also within a reasonable time cost of capital timeframe.
Mean reversions or returns to long term average trends, of course, do happen but there is no guarantee as to how long some may take.
Also, mean reversion typically overshoots both to the upside and downside as bullion market psychology, and other contributing factors allow price bubble phenomenons to become commonplace.
The following chart also expresses the Dow Silver Ratio throughout this full fiat US dollar reserve currency era.
Dow Silver Chart Full Fiat Currency Era
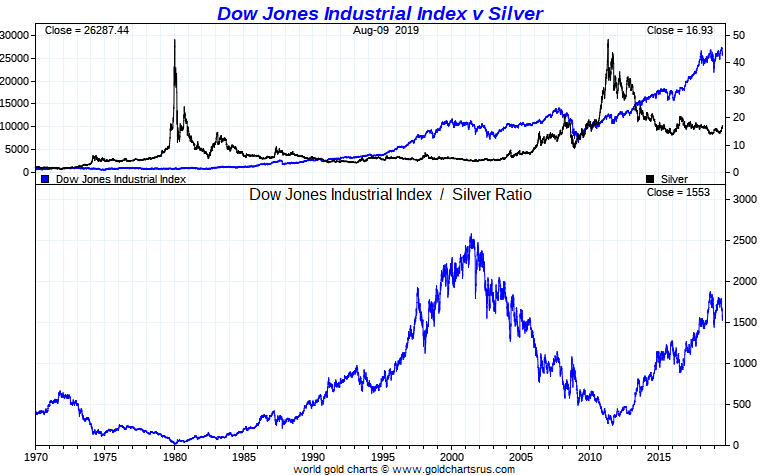
When will this latest rise in the bottom section of the chart rollover?
How far might it again fall?
Perhaps a cursory look back from 1970 to 1980 may give us a clue as to what comes next.
Dow Silver Ratio in Context vs. the S&P 500 Silver Ratio

The fallacy of using the Dow (DJIA) as a US stock valuation gauge is easy to point out.
Not one company that began with the index is still a part of the Dow nominal number.
That means all original companies have either died off, gone to bankruptcy, shrunk in valuation, and or been bought by other consolidating companies along the way.
The Dow is, in essence, a cherry stock picked primary US stock metric.
The somewhat recent dropping of General Electric (GE) from the Dow Jones Industrial Average index is but one example of this glaring fact.
Consequently, we suggest that all Dow Silver Ratio and Dow Silver Chart hawks perhaps use a more full based stock vs. silver ratio like the S&P 500 index.
Here is what we argue to be a more accurate reflection of silver stock values ongoing.
Have a look at the S&P 500 Silver Ratio over this full fiat currency era ongoing.
S&P 500 Silver Ratio Chart

When will this latest rise on the bottom section rollover and how far might it again fall?
Again, have a look back to the western led 1980 bullion bull market of to perhaps see the trend we may revisit ahead.
Many investors have been securing prudent bullion allocations today to help protect their wealth and portfolio’s exposure to potentially falling stock and currency values in the years to come.
Given how low historical silver prices are at the moment, the risk-reward on doing so appears to be asymmetrically favoring silver bullion owners moving ahead.
Thank you for visiting us at SD Bullion.
***


