

Dow Gold Ratio
The Dow Gold Ratio refers to how many shares of the Dow Jones Industrial Average stock market index one can theoretically purchase with gold.
We have data that stretches back over 200 years in the USA covering how publicly traded stocks faired and are fairing versus the ongoing value of gold continuous.
Note that every equity or stock value measuring these companies will either eventually go broke, get dropped from the index, and or get taken over by competitors given enough time (e.g., dropping General Electric proves the DOW fallacy).
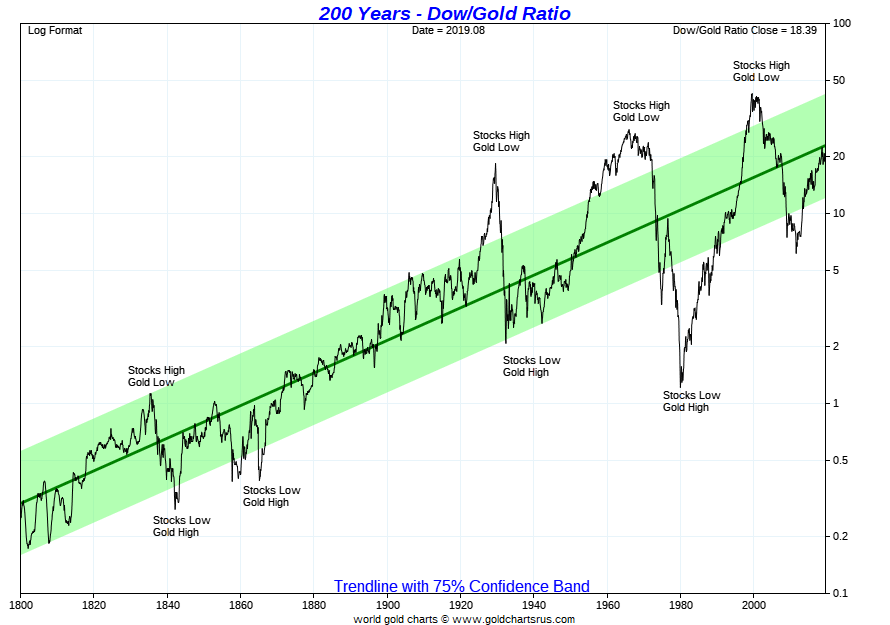
Dow Gold Chart 200 Years: Stocks vs. Gold
-
The power of the Dow Gold Chart can be seen looking back, for example, two decades ago. Take a look at the relative performance situation between gold and the DOW (i.e., U.S. stock market).
In late 1999, gold’s price was in the high $200s in fiat US dollars. The Dow was topping near the latter phase of the dotcom bubble mania phase.
After gold’s 2001 breakout, it continued to outperform in the Dow Gold Ratio in multiple legs of advance—for the next decade.
And this wasn’t merely a loss of stock valuations versus gold, but a massive gold price advancement coincident with gold’s price peak going from the $200s to above $1900 oz in fiat Federal Reserve notes by 2011.
An investor with a long view could have partially played gold’s breakout in performance in early 2001 by acquiring a prudent position when it got so cheaply valued versus financial assets at the time (similar to how gold is valued currently given record global debt levels and the papering over of the 2008 Financial Crisis without painful structural reforms).
Dow Gold Chart 200 Years: 1913 Central Bank Era | 1971 Full Fiat Currency Era

-
In 1913 the US central bank began (i.e., Federal Reserve) and in that timeframe, the US dollar has lost over 98.5% of its value to gold.
We fully expect with the current gold fundamental investment backdrop today to again see a similar fall in the Dow Gold Ratio akin to the 1976-1980 version.
Perhaps this coming rollover shall have a longer duration and further to fall as we are coming off two of the most gigantic US stock market bubbles ever formed (2001, 2019).
The lack of median Baby Boomer savings and underfunded pension dynamics guarantee the financial authorities will again intervene in our supposed free markets attempting still to prop up paper asset values as best they can, for as long as they can.
Will the Dow Jones Industrial Average index eventually reach parity with the fiat Federal Reserve Note price of gold? Or will we have had a currency crisis and financial restructuring before witnessing such a moment in the time ahead?
We suggest now is time to consider owning a prudent position in gold bullion for all stock price bubbles eventually give way to precious monetary commodity values in time. Just look at the charts above, and then ask yourself which way you think they generally will go in the coming decades.
To learn more about best practices for both buying gold and perhaps eventually selling gold. We suggest picking up our free SD Bullion Guide by email right now.
Thanks for visiting us here at SD Bullion.