Gold, Silver, and the Housing Connection: Lessons from CNBC’s Market Insight
-
CNBC India Spotlight: SD Bullion senior analyst James Anderson appeared on CNBC TV18 with Manisha Gupta, offering one of the most detailed breakdowns of gold and silver price behavior, positioning himself as a trusted global voice on the precious metals trade.
-
Tariff Confusion Sparks Volatility: A misinterpretation of a U.S. Customs ruling briefly suggested tariffs on Swiss gold bars, causing futures to spike $120 above London spot (8/8/2025). Anderson explained how easily misinformation can whipsaw markets, underscoring gold’s sensitivity to policy rumors.
-
Underlying Fundamentals Drive Prices: While headlines about U.S.-Russia talks and U.S.-China trade truces create noise, Anderson emphasized that long-term gold pricing is tied less to geopolitics and more to structural forces—central banks de-dollarizing, shifting into bullion, and fiat currency instability.
-
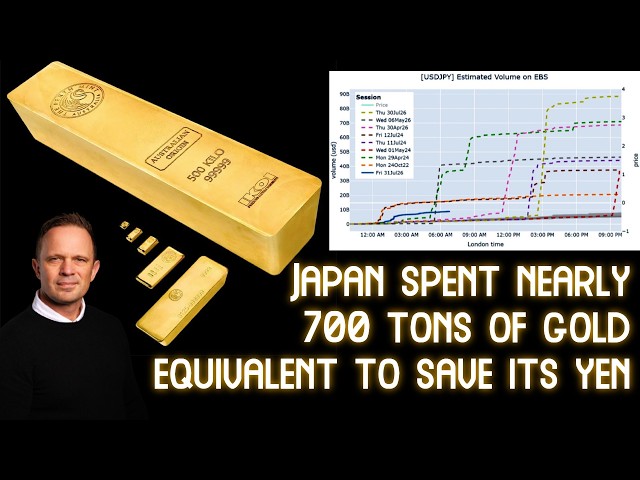
Historical Gold-to-Housing Insight: Long-term charts show how many ounces of gold it takes to buy a U.S. median home. In the late 1960s–early 1970s, roughly 700 ounces were needed; by 1980, it dropped to just 70 ounces. The pattern appears to be repeating today, signaling potential undervaluation of gold relative to housing.
-
Silver’s Industrial Strain: Anderson highlighted that 81% of newly mined silver now goes to industrial uses—from solar panels to automobiles—leaving only 19% for investment. This structural squeeze is quietly setting up for future shortages and silver price surges.
-
Supply Tightness & Direct Deals: With five consecutive years of silver deficits, industrial players are reportedly bypassing exchanges and going straight to miners and refiners to secure guaranteed supply—evidence of an increasingly fragile silver pipeline.
-
Investor Takeaway on Silver: Anderson cautioned that waiting for official “shortages” is too late. Historically, physical premiums spike above spot during crises (2008, 2023 bank runs), leaving investors locked out. His message: build positions before bottlenecks emerge.
-
Price Trajectories: Gold is expected to test $3,000 support before pushing beyond $3,500 by year-end. Silver may retest its 1980 nominal high of $50 within two years, with the longer-term roadmap pointing toward triple-digit silver prices in the next decade.
-
Opacity of Global Gold Trade: The Financial Times and ECB have raised concerns about the opaque structure of the LBMA and OTC gold markets. Anderson echoed that “digital derivative pricing” dominates, but when physical demand overwhelms, no institution can stabilize supply quickly.
-
Investor Education Message: The key takeaway from Anderson’s CNBC interview is his emphasis on focusing less on short-term market headlines and more on the historical role of bullion as a store of value. Gold and silver have long been viewed not just as commodities but as measures of purchasing power—illustrated by the fact that, across time, an ounce of gold could once buy a house and continues to serve as a benchmark of relative stability amid currency shifts..
SD Bullion's senior analyst explains to CNBC India why gold and silver prices are driven less by headlines and more by structural shifts, from central bank buying to industrial demand—and how history shows gold once bought a house, and may again.
I went on CNBC India again this week to discuss gold and silver markets with Manisha Gupta.
We'll cover that discussion in the 2nd half of this week's SD Bullion Market Update.
But first we need to cover other goings on.
This afternoon, the USA with President Donald Trump and Russia with President Vladimir Putin held a summit in Anchorage, Alaska to discuss a potential end to the Russia-Ukraine war.
The near 3 hour meeting served more as groundwork for future negotiations than a decisive resolution, leaving the Russia-Ukraine conflict's trajectory uncertain in the near term.
What actually came of the meeting in other words is about this incoherent.
To start this week on Monday Aug 11th, President Trump confirmed imported gold bullion will not be tariffed.
Speaking of tariff income, apparently the US brought in $28 billion last month July 2025.
With total tax receipts of $338 billion verse an estimated $630 billion spent on the month.
A growth of the US deficit of nearly $291 billion in just last month July alone.
We are seeing more headlines of underscoring a broader shift in U.S. policy toward industrial support in critical sectors like advanced chip manufacturing on domestic soil as opposed to over in Taiwan, diverging from ou nation's alleged free-market principles.
More troubling US housing data from the National Association of Realtors.
Apparently elderly US home buyers aged 70 years and older outnumber buyers under 35 years old.
According to the NAR data 70% of current US house buyers are aged 45 yrs and older.
Continuing on US housing data, I have new long term charts illustrating median US house prices going all the way back to the London Gold Price rigging pool of the 1960s to now in 2025.
A somewhat recent price rollover for the middle house price sold in the USA has fallen to just over $401k.
But when measured by the sum of gold required to buy a median US price house over the last more than 60 years, the price inflation fog lists to show a distinctive pattern going all the way back to when then President Nixon defaulted on the US dollar's final formal ties to gold 54 years ago today August 15, 1971.
Within less then a decade that followed, gold in US median house buying power nearly 10 folded. In other words the median US house that once cost nearly 700 oz of gold to buy cost only near 70 oz of gold to buy by early 1980.
You can see in the 21st Century we appear to be repeating a similar pattern on this chart.
We appear to now be on the cusp of falling below low levels hit during the 2011 gold record price run.
Measuring median US house prices by silver, the story is similar but slower moving for now.
If US median priced homes stayed flat at $400k, the price of silver would have to more than double to near $80 oz spot in order to return to the relatively low levels reached in the early 2011 silver price run near fifty.
In probably the most important gold related financial media piece this week, the former director of Argor Heraeus
wrote on op ed in the Financial Times arguing that the London Bullion Market Association (LBMA) and the London Precious Metals Clearing Limited both private trade group and private bank run consortium remain too opaque and under regulated. Arguing that the Bank for International Settlements should step in to overseeing core elements of gold market infrastructure.
He cited the recent European Central Bank's warning that under extreme events the current global gold market system poses financial stability risks. The ECB has publicly stated, "vulnerabilities have arisen because commodity markets tend to be concentrated among a few large firms, often involve leverage and have a high degree of opacity deriving from the use of OTC [over-the-counter] derivatives . . . Disruptions in the physical gold market could increase the risk of a squeeze."
In an example of this opacity in real time misleading charts and data, Bloomberg published the following data set last week misleading readers by stating that "$300 billion of gold changes hands every day". It would have been high ninety percentile more accurate to instead state, "$300 billion of gold derivatives trade everyday".
The world gold market has about 252 trading days per year, that is about $2.1 billion per day in newly mined and recycled gold supply coming to the world's physical markets. The vast majority of some estimated 80,000 tons of gold held as a stores of value in large bullion bar formats by central banks or in smaller bars and coins by investors worldwide. Those holdings are nearly never for sale.
What we have in gold and often more so like silver too, is mainly a digital derivative proxy price discovery system. When the world needs the real things, bullion in size. We'll have a problem that neither the LBMA or the BIS for instance has any chance of quelling quickly.
The Washington Post published an investigative piece this week about illegal Chinese gold mines spanning 3 continents now between South America, Africa, and SE Asia.
China's often illegal mining various jurisdictions often by bribing local authorities. That has been going on for over a decade in varying parts of the world, even in the Amazon jungle.
This is the new normal now Western man, China's insatiable demand for gold and other commodities shows next to no signs of slowing down.
Silver and gold prices were a mix of flat to slightly down this week.
The spot silver price closed at $37.97 oz bid and the spot gold price ended the week at $3,336 oz bid.
The spot gold silver ratio ended the week down a touch at 87.
This past Tuesday morning, I spoke with Manisha Gupta of CNBC TV18 in India for about 16 minutes.
It's a pretty wide ranging discussion of gold and silver not merely in the short but the longer term.
The best tactic in precious metals is buying and holding with a long view, and not trading in and or out all too often for in the short term, we can only guess where the markets might swing.
Towards the end of segment I made sure to remind Indian investors out there to go out, buy and own the real things outright. Starting and establishing an ongoing bullion position is the best general route for most investors in my experience.
CNBC TV18 India interview with SD Bullion's James Anderson
https://youtu.be/36bjgoPkQpI?si=RHxBq3KAzlg3b-k7&t=778
That will be all for this week's SD Bullion Market Update.
And as always, take great care of yourselves and those you love.
References:
FT: The gold market is too important to be left to private clubs
https://archive.is/Ya9F4
Global 'mining mafia' feeds China's appetite for gold, 3 continent investigation shows:
https://archive.is/pI4dg - https://www.washingtonpost.com/world/2025/08/12/china-gold-illicit-mining-indonesia/