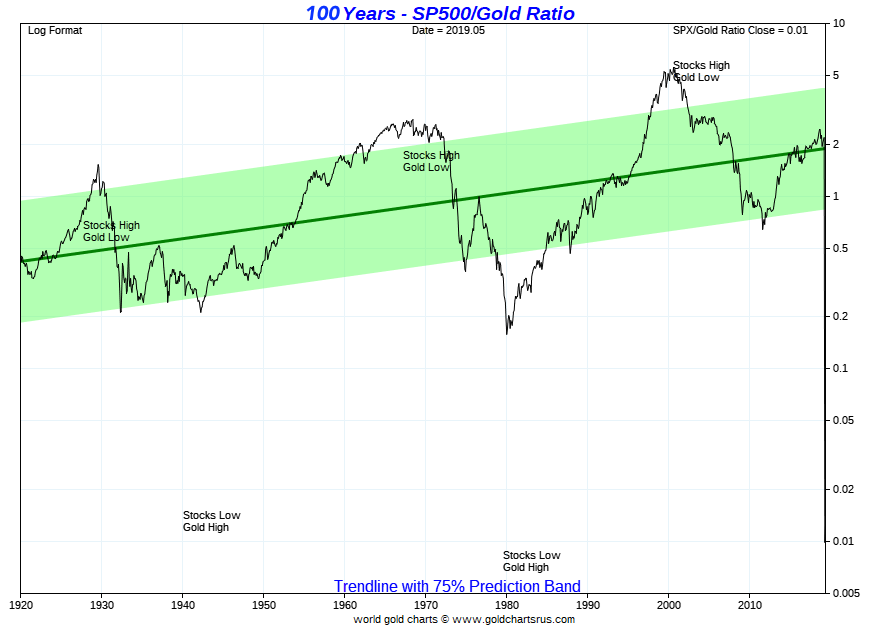
The following Gold vs. S&P 500 chart tracks the ratio of the S&P 500 stock market index to the fiat US dollar price of gold per troy ounce.
The number tells you how many ounces of gold bullion priced in fiat US dollars it would take to buy the S&P 500 at any given time over the past 100 years.
The lowest the Gold vs. S&P 500 ratio has reached during the 1980 gold bull market peak where the prices of virtually all commodities were hitting then record nominal price highs as well.
The 1980 gold price reached over $850 oz yet since then in 2011 gold prices hit their still record nominal price high of over $1,900 US dollars per troy ounce.
There is a mathematical backtested argument to be made for always holding a prudent allocation to gold bullion in one’s investment portfolio.
Gold vs S&P 500 Chart - [ 100 Years ]

With the S&P 500 currently near record nominal price high levels, it makes good sense to be taking some profits and perhaps allocate them into precious metals such as gold.
If history was to repeat and the Gold vs. S&P 500 ratio was to drop substantially again, the chances of being able to acquire nearly 10Xs the amount of S&P 500 stock shares using gold bullion is a possibility in the coming decade(s) potentially.
Thanks for visiting us here at SD Bullion.
***


