


First let us begin this analysis with a clear explanation of what the gold silver ratio is.
Gold Silver Ratio Definition
Gold Silver Ratio - (n) a moving ratio measurement of the amount of silver one can buy with a fixed amount of gold. Typically in the western world the gold to silver ratio is measured in the amount of troy ounces of silver one can acquire with 1 troy ounce of gold. Although it can also be measured in grams, kilos, tonnes, etc.
Gold Silver Ratio Meaning
Physical gold and silver have been used as money for millenia dating as far back as 600 BC in ancient Lydia’s mixed electrum coinage. Yet the ratio of how much non-fungible silver could be purchased using non-fungible gold parts is even more ancient than that. Historic records show that the gold silver ratio dates back to Menes, Egypt in 3200 BC in which 2.5 parts of silver was equivalent to 1 part gold.
This literally means that in ancient Egypt you could trade 5 oz of pure silver for 2 oz of pure gold. To calculate the meaning of the gold silver ratio you can simply multiply the current, past, or potential future gold silver ratio by the amount of gold you may move into silver to garner the total silver proceeds (and vice versa). If moving back into gold from silver, simply divide the amount of silver by the current, past, or potential future gold silver ratio to determine the total gold proceeds.
Historical Importance of the Gold Silver Ratio
Perhaps you have heard of historical empires who used monetary systems based on a silver standard, gold standard, or a fixed or fluctuating gold silver standard (i.e. bimetallism).
The importance of the gold silver ratio helps to tell motivations behind a large portion of human history, from the ancient Egyptian empire all the way to our present day’s waning western Anglo-US empire.
For example, western world exploration was directly motivated by the effort of European nations efforts to acquire more gold and silver for their respective countries and personal fortunes. The fall of the Aztec empire was a result of the then Spanish colonizers lust for gold and silver. Around that time, the gold silver ratio was established in the Edict of Medina as 10.07 parts silver to 1 part gold.
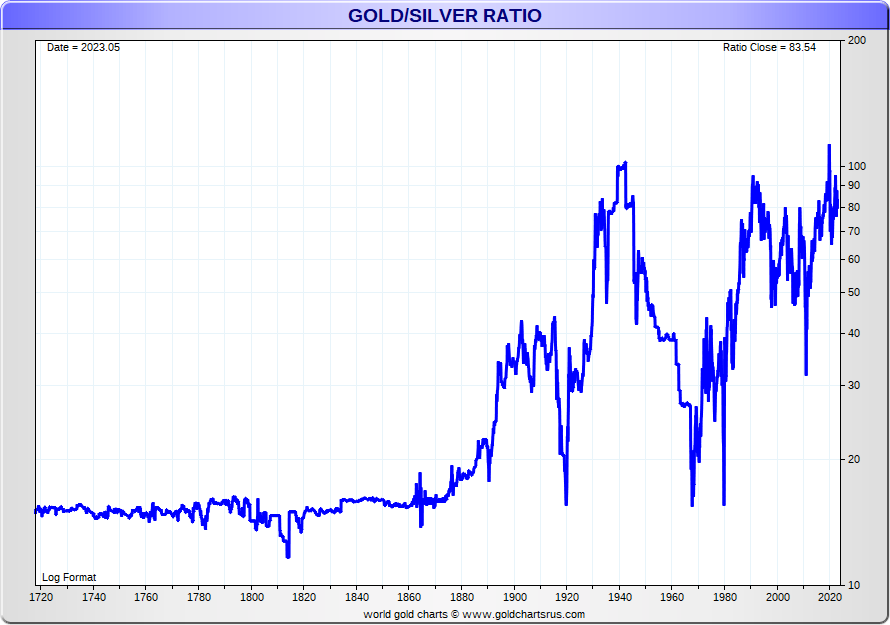
The following chart illustrate the gold silver ratio after western world colonization gave way to the establishment of the United States of America (1776 AD) and eventually into both large bank interest (1873 AD) and ultimately central bank / government forced gold silver ratio interventions (e.g. 1933, 1934).
Gold Silver Ratio 300 year Chart
Trading the Gold Silver Ratio
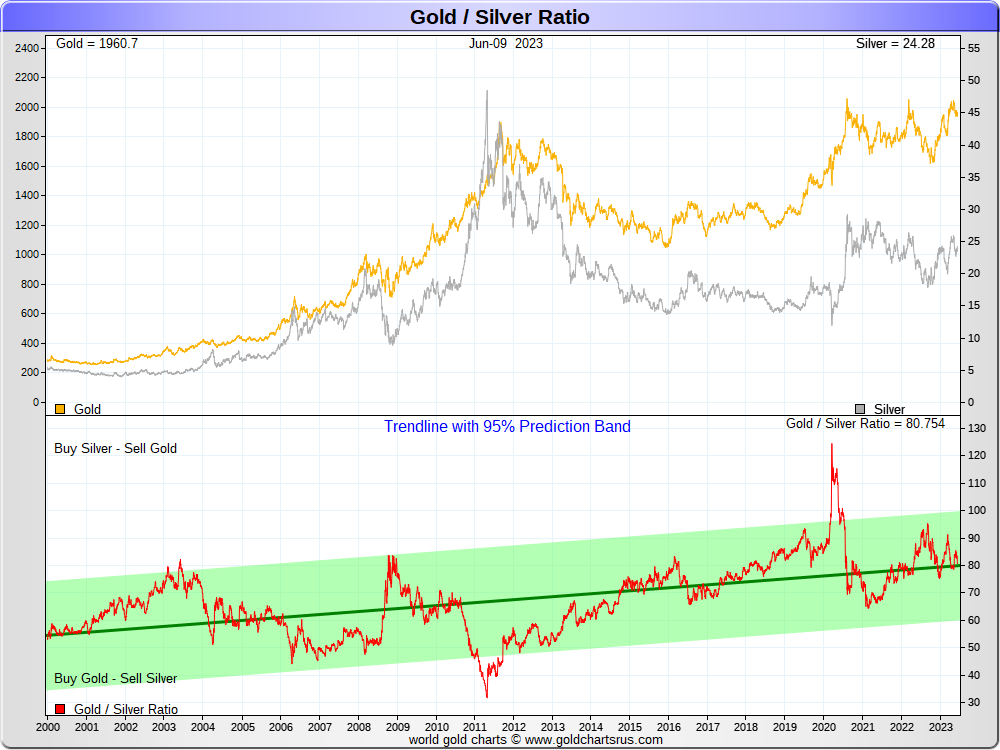
Many claim to trade the gold silver ratio meaning they seek to switch either silver or gold holdings when the gold silver ratio swings to historically determined "extremes."
So as an example during Covid 2020, as the gold silver ratio ran to a record high above 100 peaking above 120 in the spot gold silver ratio, a trader who possessed 1 ounce of gold could have theoretically sold their single gold ounce for +100 ounces of silver during that short timeframe.
Of course this theory does not take into account the risks nor costs associated with trading either electronic traded precious metal proxies (ETFs, derivatives can fail or become frozen) or even tax repercussions associated with swapping (not like kind metals) but one specific physical precious metal for another (e.g. gold bullion for silver bullion, or silver bullion for gold bullion, etc.).
What does the Gold Silver Ratio mean?
The Gold Silver Ratio is used by both short term traders and even long term holders of gold and silver measuring perhaps when one metal is overvalued vs the other (e.g. gold vs silver or silver vs gold).
We believe for physical silver bullion and gold bullion buying one needs to have a long term time horizon and perspective. The low 30s gold silver ratio hit in 2011 AD was likely a mere foretelling of where the gold silver ratio will ultimately peak in this 21st Century Gold Rush.
Our opinion is that the long term gold silver ratio will again revist the teens before gold and silver values have peaked in this 21st Century Gold Rush.
Perhaps try revisiting the 300 year chart we posted above to get an idea as to why we believe this is merely history rhyming (e.g. 1720-1860, 1919, 1968, 1980, 20??).
Stack and possibly swap between gold and silver accordingly.
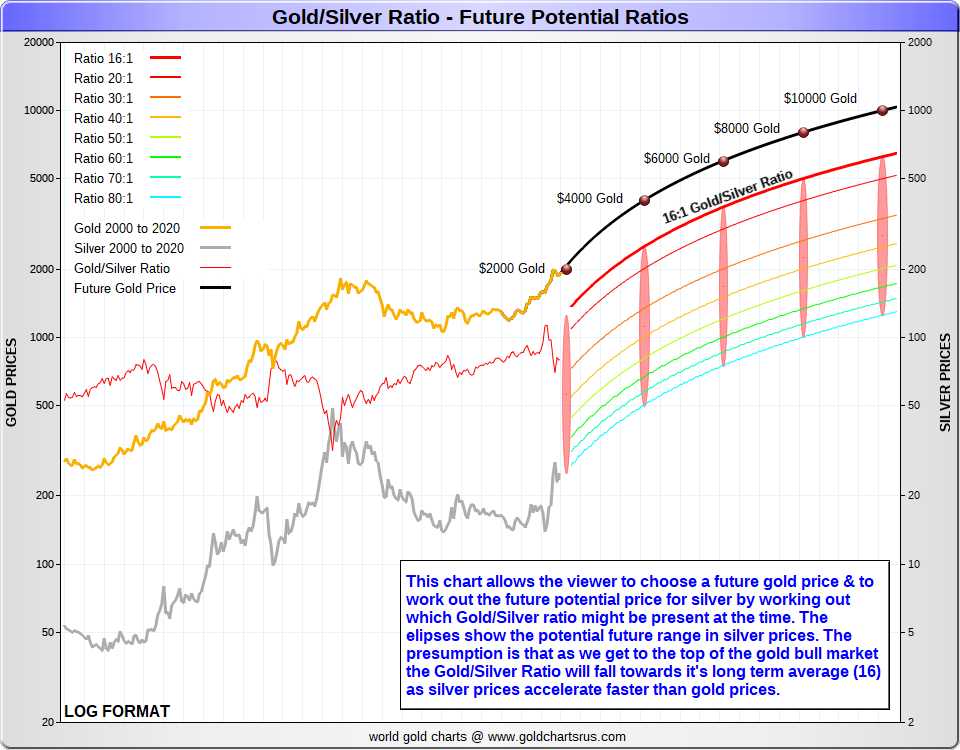
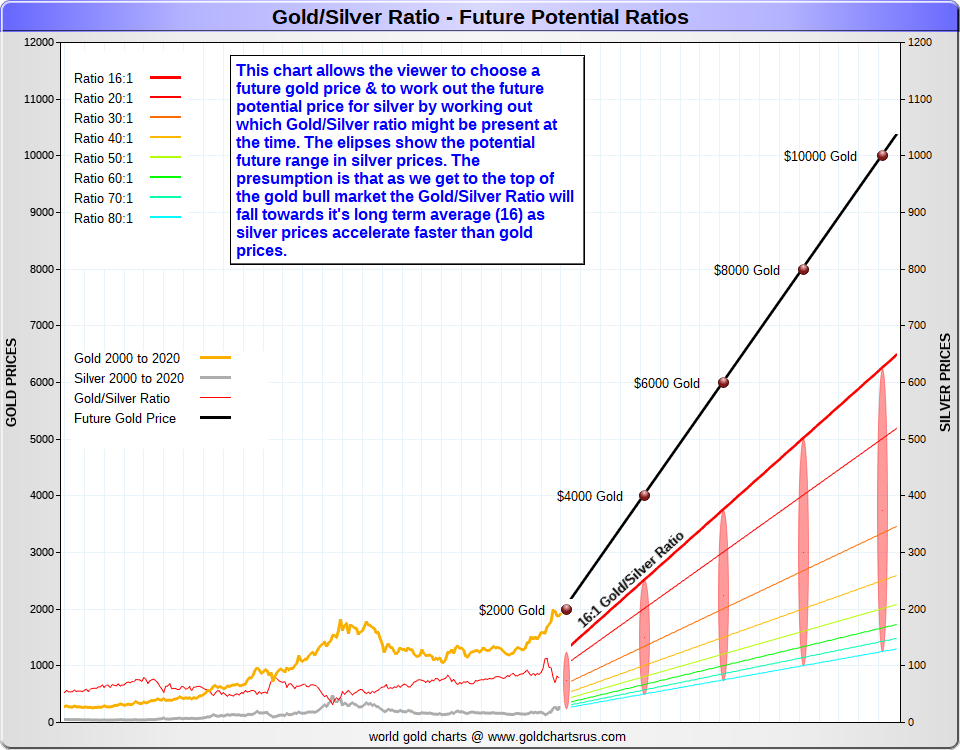
Gold Silver Ratio Future Potential Chart
The following chart gives gold and silver price and ratio potentiality ahead. If you believe the price of gold will rise in the coming years, the following ellipses can help determine what the US dollar silver price could be per troy ounce with various gold silver ratio levels ranging from the current +80 ratio, past the 2011 peak of just above 30, all the way down to the multi-millennial average of 16.
Finally, the following video can give you a backwards looking idea of how some bullion buyers suggest using the gold silver ratio to buy or sell on or the other precious metal when ratio levels near peaks.
The theoretical results are obviously using ‘cherry picked’ data and backward looking, thus the results are therefore inflated.
But the fundamental principle may be sound in managing one’s bullion bedrock investment portfolio positions as not having any allocation to bullion while living under fiat currency regimes is unwise and short sighted.


