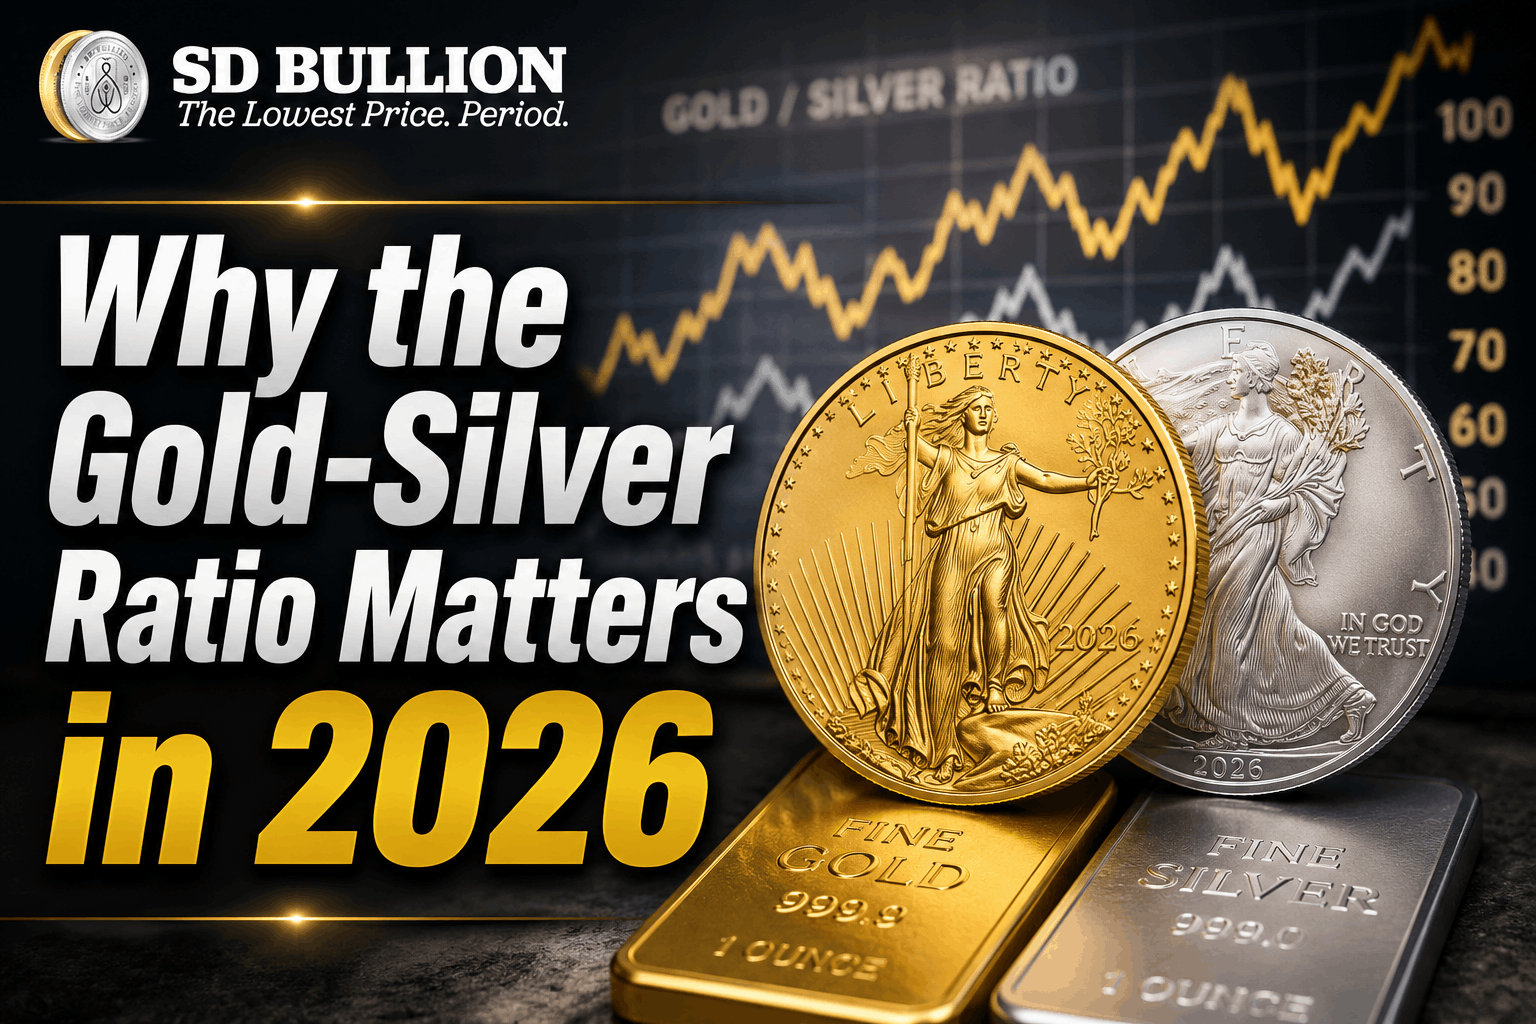
The Gold-Silver Ratio matters in 2026 because it serves as a reliable metric to identify whether physical gold or physical silver is relatively undervalued.
Many precious metals investors rely on the ratio to time purchases, rebalance holdings, and compare opportunities between gold and silver in response to current market conditions.
Key Takeaway:
- The Gold-Silver Ratio measures how many ounces of silver are required to buy one ounce of gold and helps investors compare the relative value of both metals.
- Historically, ratios above 80:1 have often suggested silver is undervalued, while ratios below 50:1 have often indicated gold is undervalued relative to silver.
- Precious metals investors use the ratio to rebalance holdings, accumulating silver at high ratios and shifting back into gold when the ratio contracts.
- In 2026, silver supply deficits, strong industrial demand, and tightening inventories have increased investor focus on the Gold-Silver Ratio as a valuation and portfolio management tool.
Jump to: What is a High Gold-Silver Ratio? | When to Trade for Profit? | What is a Normal Ratio? | What Causes Rise and Fall? | Why Silver Moves More? | Which Asset Wins in 2026? | Silver Outlook in 2026 | FAQs
What is a High Gold-Silver Ratio and What Does It Mean?
A high gold-silver ratio means it takes more ounces of silver to buy one ounce of gold, suggesting silver may be undervalued relative to gold. For example, if the ratio is 100:1, it takes 100 ounces of silver to buy 1 ounce of gold, whereas a lower ratio, such as 50:1, suggests gold may be undervalued relative to silver.
Historically, ratios above 80:1 have often suggested silver is undervalued relative to gold, while ratios below 50:1 have often suggested gold is undervalued relative to silver.
Investors can check the Gold-to-Silver ratio live on the SD Bullion chart or calculate it. The math to it is dividing the spot price of gold by the current price of silver.
When the ratio reaches historic highs, many investors turn to lower-premium 1 oz silver rounds or bars rather than gold, tracking pricing through SD Bullion's spot price charts along the way.
When to Trade the Gold-Silver Ratio for Profit
When the ratio reaches historically high levels, such as 80:1 or higher, some investors view silver as undervalued relative to gold and choose to accumulate silver instead. If the ratio later contracts to 60:1, 50:1, or lower, they may exchange their silver holdings back into gold.
For example, at an 80:1 ratio, an investor could exchange 1 ounce of gold for 80 ounces of silver. If the ratio later contracts to 50:1, those same 80 ounces of silver would be equivalent to 1.6 ounces of gold. In theory, the investor increases their gold holdings by 60% without adding new capital, simply by taking advantage of a change in the Gold-Silver Ratio.
Many precious metals investors use a simple framework: ratios above 80:1 often favor accumulating silver, ratios near 60:1 may favor accumulating gold, and ratios in between are often viewed as neutral.
During these middle ranges, investors frequently focus less on the ratio itself and more on factors such as product premiums, liquidity, recognizability, and overall product quality.
To follow how the ratio is shifting day to day, investors can pull up SD Bullion's gold and silver spot price charts, updated in real time with current bullion pricing.
Historical Gold-Silver Ratio Averages
For much of recorded history, the Gold-Silver Ratio remained remarkably stable.
According to commonly cited numismatic history, ancient Egypt valued gold at roughly 2.5 times the price of silver, the Roman Republic fixed the ratio near 8:1, and Julius Caesar adjusted it to 11.5:1. The United States later adopted a verifiable 15:1 ratio under the Coinage Act of 1792, and throughout the 20th century, the ratio averaged approximately 47:1.

Unlike the fixed ratios of the past, today's Gold-Silver Ratio is determined entirely by market forces, making it highly sensitive to changes in supply, demand, investor sentiment, and macroeconomic conditions.
During the COVID-19 pandemic, the gold-silver ratio hit an all-time high of roughly 125:1 in March and April 2020. To put today's Gold-Silver Ratio into perspective, consider the following historical and recent market benchmarks:
|
Event |
Ratio |
|
Coinage Act of 1792 |
15:1 |
|
COVID Panic (2020) |
125:1 |
|
April 2025 Peak |
107:1 |
|
December 2025 |
Below 55:1 |

What Is Driving the Gold-Silver Ratio in 2026?
According to the World Silver Survey 2026 published by The Silver Institute and Metals Focus, the main drivers of silver prices through 2026 were structural supply deficits and shrinking available inventories.
Years of undersupply reduced market liquidity, while record investment demand through silver-backed funds, rising physical bullion demand, and strong industrial consumption further tightened the market. Combined with geopolitical uncertainty and shifting monetary policy expectations, these factors helped propel silver to multi-year highs and increased price volatility.
Structural supply deficits, record investment demand, and strong industrial consumption helped drive silver's outperformance during parts of 2025. After peaking at 107:1 in April 2025, the Gold-Silver Ratio fell below 55:1 by December as strong physical demand and tightening inventories pushed silver prices higher relative to gold.

Today, investors use the Gold-Silver Ratio not as a fixed monetary benchmark but as a valuation tool to identify periods when gold or silver may be relatively overvalued.
Dealer platforms like SD Bullion give investors a real-time view of gold and silver pricing, making it easier to spot ratio shifts and weigh opportunities between the two metals as they happen.
What Is a Normal Gold-Silver Ratio?
Here's how the current ratio stacks up against those historical ranges, using SD Bullion's gold and silver spot price charts, refreshed throughout the trading day, as a reference point.
|
Ratio |
Common Interpretation |
|
Above 80:1 |
Silver may be undervalued |
|
60:1-80:1 |
Moderately favors silver |
|
50:1-60:1 |
Neutral range |
|
Below 50:1 |
Gold may be undervalued |
|
Below 40:1 |
Historically favors gold |
What Causes the Gold-Silver Ratio to Rise or Fall?
The Gold-Silver Ratio rises when gold outperforms silver and falls when silver outperforms gold. Economic uncertainty and recessions often increase demand for gold as a safe-haven asset, pushing the ratio higher.
Strong industrial demand, manufacturing growth, and silver supply deficits can strengthen silver prices and drive the ratio lower.
Why Silver Usually Moves More Than Gold?
Silver is both a monetary metal and an industrial metal. Because the silver market is smaller than the gold market, changes in investor demand or industrial demand often produce larger percentage price movements.
This higher volatility is one reason the Gold-Silver Ratio can change rapidly during bull and bear markets.
Gold Coins vs. Silver Bars: Which Asset Wins in 2026?
Gold coins provide unmatched global recognition and resale liquidity, while silver bars allow investors to acquire more ounces of precious metal per dollar invested, thanks to their lower premiums over spot.
|
Feature |
Sovereign Gold Coins (e.g., 2026 1 oz American Gold Eagle) |
Silver Bars (e.g., 10 oz Silver Bars) |
|
Liquidity |
Maximum liquidity due to government backing, global recognition, and strong dealer buyback markets |
High liquidity, though generally lower than leading sovereign bullion coins |
|
Premiums |
Typically carry higher premiums over the gold spot price |
Usually trade at lower premiums over the silver spot price |
|
Cost Efficiency |
Investors pay more for recognizability and ease of resale |
Investors acquire more ounces of silver per dollar invested |
|
Best Use Case |
Long-term wealth preservation and maximum resale recognition |
Accumulating silver ounces at the lowest possible cost |
Before choosing between sovereign gold coins and investment-grade silver bars, it's worth checking current premiums, liquidity, and cost per ounce side by side — SD Bullion's pricing tools make that comparison straightforward.
What Is the Outlook for Silver in 2026?
The outlook for silver in 2026 remains supported by ongoing supply deficits, tightening inventories, strong industrial demand, and continued investor interest. These factors have increased expectations of higher volatility and potentially larger price moves than in previous years.
According to the World Silver Survey 2026 published by The Silver Institute and Metals Focus, the silver market recorded a fifth consecutive annual deficit of 40.3 million ounces. The report also noted tighter inventories and a surge in investor demand, with coin and bar purchases rising 14% and silver averaging more than $40 per ounce, up 42% from 2024.
With five consecutive years of market deficits and inventories under pressure, the silver market appears to be entering an era of tighter supply, thinner liquidity, and potentially larger price moves.
Silver has been considered a precious metal for more than 6,000 years. Long before modern financial markets existed, it was used as currency, a store of value, and a medium of exchange across ancient and modern civilizations, establishing its role as one of history's most important monetary metals alongside gold.
The question for investors is not whether gold or silver has a role in a portfolio, but which form of ownership offers the best balance of liquidity, cost efficiency, and flexibility in today's market. Watching how silver premiums and bullion inventory shift over time, through resources like SD Bullion's spot price charts, can help investors gauge how current market conditions are affecting the metal.
FAQs
What is the gold-silver ratio, and how is it calculated?
The Gold-Silver Ratio measures how many ounces of silver are required to buy one ounce of gold. It is calculated by dividing the current gold price by the current silver price. For example, if gold trades at $4,000 and silver at $50, the ratio is 80:1.
Why does a high gold-silver ratio suggest silver might be undervalued?
A high ratio means silver is relatively cheap compared to gold. Historically, some investors view elevated ratios as a sign that silver may have more upside potential, especially if the ratio later falls toward long-term averages.
What does the current gold-to-silver price relationship indicate?
The current ratio reflects how the market values gold relative to silver, based on economic conditions, industrial demand, investor sentiment, and precious-metals fundamentals. A rising ratio favors gold's relative performance, while a falling ratio indicates silver is outperforming.
How do silver stackers use the gold-silver ratio to time purchases?
Many silver stackers buy more silver when the silver-to-gold ratio is at a historically high level because silver is relatively inexpensive compared to gold. When the ratio falls, they may shift purchases toward gold or exchange some silver holdings for gold.
What is a gold-silver ratio trading strategy for beginner investors?
A common strategy is to accumulate silver when the ratio is unusually high and consider swapping silver for gold when the ratio falls significantly. The goal is to increase total metal holdings over time without adding new capital.
How can investors use the gold-silver ratio for portfolio rebalancing?
Investors may use the ratio to adjust their allocation between gold and silver. High ratios can signal an opportunity to increase silver exposure, while low ratios may favor shifting part of a portfolio back into gold.
How does industrial silver demand affect the gold-silver ratio?
Unlike gold, silver has substantial industrial uses in electronics, solar panels, medical applications, and manufacturing. Strong industrial demand can boost silver prices relative to gold, causing the Gold-Silver Ratio to decline.
Is there a correlation between the gold-silver ratio and inflation?
There is no direct correlation. Both metals often benefit from inflation concerns, but the ratio is primarily influenced by the relative performance of gold and silver rather than inflation itself. Industrial demand and investor sentiment also play major roles.
Does the gold-silver ratio predict economic recessions?
No. The ratio is not a reliable recession indicator. However, it often rises during periods of economic uncertainty because investors tend to favor gold's safe-haven characteristics over silver's more economically sensitive demand profile.
How does the gold-silver ratio compare to the gold-platinum ratio?
The Gold-Silver Ratio compares two monetary metals with long investment histories. The Gold-Platinum Ratio compares gold with a primarily industrial metal whose price is more heavily influenced by demand from the automotive, chemical, and manufacturing sectors.
Track the Gold-Silver Ratio in real time and compare current gold and silver premiums using SD Bullion's live spot price charts before your next purchase.