Gold Pushes Above $4,400, Asian Silver Demand Accelerates, and Debate on Extreme Price Targets Return $1,000 Silver Price Forecasts
- Gold and silver extended their advance, with spot gold price ending the week around $4,375 an ounce and silver at $64.55, while the gold-silver ratio eased to roughly 67:1.
- Gold’s longer-term bull case remains closely tied to fiscal deterioration. U.S. national debt is approaching $40 trillion, while large monthly deficits and elevated interest costs continue to reinforce concerns over currency debasement and sovereign finances.
- Gold has recovered from its midyear consolidation. After spending much of June and July between roughly $4,000 and $4,200, gold bullion broke higher in early August and subsequently traded above $4,400.
- China, Treasury yields and Japan have emerged as potential catalysts for gold’s renewed strength. The market has focused on reports of accelerating Chinese purchases alongside concerns over U.S. bond yields and the possibility of Japan reducing Treasury holdings.
- Precious-metals trading is becoming increasingly accessible around the clock. CME’s expansion of gold futures toward 24/7 trading gives investors additional ability to hedge and react to weekend and off-hours developments, potentially increasing speculative participation.
- China’s physical precious-metals market remains heavily tilted toward gold. Bullion benefits from VAT-free treatment, while silver and platinum face a 13% VAT, leaving Chinese retail silver investment relatively small despite the country’s enormous role in global refining and industrial consumption.
- India is emerging as a significant source of incremental silver demand. Indian silver ETFs reportedly absorbed nearly 14 million ounces in July alone, while the country is forecast to require another roughly 4,000 tonnes—about 130 million ounces—before year-end.
- Artificial intelligence is adding another dimension to industrial silver demand. The update cites an estimate of just over 40 million ounces of silver consumption tied to AI infrastructure build-outs, roughly half the amount attributed to global automobile manufacturing.
- Bullish silver forecasts are becoming increasingly aggressive, but timing remains contentious. Analyst Michael Oliver has discussed prices above $300 and potentially $1,000 an ounce, while the update argues that relative valuations—such as silver versus gold, equities and housing—may ultimately matter more than any headline nominal target.
- The overarching thesis is that silver could eventually outperform gold as monetary and physical-market pressures intensify. The update expects a substantially lower gold-silver ratio and argues that silver could reach prices in the hundreds of dollars over a longer horizon, while explicitly cautioning that such a move is not expected within the next year and may instead unfold over the coming decade.
Gold Pushes Above $4,400, Asian Silver Demand Accelerates, and Extreme Price Targets Return to the Spotlight
Gold and silver moved higher again this week, with spot silver price closing at $64.55 per ounce and spot gold finishing at $4,375 per ounce. The gold-silver ratio ended near 67 ounces of silver for one ounce of gold, ticking slightly lower as both metals advanced.
Gold Breaks Out of Its Summer Trading Range
For most of June and July, gold remained locked in a relatively tight consolidation range, with approximately $4,200 per ounce serving as resistance and $4,000 as the psychological floor. That consolidation represented a substantial pullback from gold's January all-time high, with the metal at one stage more than 25% below that peak.
That changed on August 5, when gold broke out of the range. Prices subsequently traded above $4,400 per ounce, putting the metal in position to potentially extend its recovery. The narrative surrounding gold also shifted with the breakout, with renewed attention turning toward reports of accelerating Chinese gold purchases.
China was not the only factor cited. Analysts have also focused on recent words and actions from the U.S. Treasury suggesting concern about elevated bond yields. Currency-market intervention involving the Japanese yen has added another dimension, with speculation that U.S. officials want to avoid a scenario in which Japan becomes a significant seller of its Treasury holdings.
U.S. Debt Remains a Major Part of Gold's Bigger Picture
Behind the shorter-term price action is a much larger fiscal story. U.S. national debt is approaching $40 trillion, having more than doubled since gold traded near its late-2015 bottom of approximately $1,050 per ounce. Over roughly the same period, gold has increased more than fourfold.
The trajectory continues to attract attention. The document points to a recent monthly U.S. budget deficit of $432 billion, while an aging population and the cost of servicing government obligations with interest rates near 5% threaten to produce still larger deficits and additional debt. From a long-term precious-metals perspective, the argument is that government fiscal problems and currency devaluations have historically accompanied major advances in gold's relative value.
Gold Trading Moves Toward a 24/7 Market
The structure of precious-metals trading is changing as well. CME Group recently launched gold futures that trade essentially 24 hours a day, seven days a week, filling the previous gap in weekend trading hours. Because gold is a global commodity whose fundamental market never operated strictly around U.S. trading hours, the expanded schedule gives market participants additional opportunities to hedge risk and react to developments occurring outside traditional sessions.
The development could also bring more retail speculation into precious-metals derivatives. The document argues that outsized derivatives continue to exert significant influence over the day-to-day spot prices of gold, silver and other precious metals, making the expansion of around-the-clock leveraged trading an important development to watch.
China's Gold Market Dominates Its Silver Investment Market
Physical-market developments in China tell a notably different story for gold and silver. A Metals Focus report highlighted in the update suggests China's market has increasingly become one dominated by gold bullion rather than high-grade gold jewelry when measured by ongoing weight sold.
Tax treatment provides gold with a significant advantage. Gold bullion in China trades VAT-free, while silver and platinum bullion face a 13% VAT in addition to dealer premiums. Consequently, Chinese investment demand for silver bullion remains relatively small compared with gold. Estimated Chinese investor purchases of silver bullion amount to slightly less than 13 million ounces annually, a modest figure compared with a global physical silver market approaching one billion ounces.
China's industrial silver footprint, however, is another matter. Halfway through 2026, the country was on pace to import more than 4,000 tonnes of fine silver, primarily for industrial uses. China is also the world's largest silver refiner, with substantial quantities of silver entering the country as a byproduct of other major metals mining operations before being refined and, in some cases, exported again.
Indian Silver Demand Surges
India is emerging as another major component of the physical silver story. In July alone, Indian silver ETFs collectively purchased nearly 14 million ounces, according to the figures cited in the update. That comes ahead of India's important festival and wedding seasons during the second half of the year.
India is forecast to require another 4,000 tonnes of silver before the end of 2026, equivalent to nearly 130 million ounces. The update suggests a meaningful portion of that metal may ultimately need to come from China. If physical demand accelerates while available London inventories decline, the resulting pressure could again push silver lease rates into the broader financial spotlight.
AI Adds Another Source of Industrial Silver Demand
Artificial intelligence infrastructure is also beginning to appear as a measurable component of silver consumption. The update cites what it describes as the first estimated breakdown it has seen for industrial silver demand associated with AI build-outs, putting the figure at just over 40 million ounces.
For perspective, that estimate is approximately half the amount of silver reportedly consumed each year by automobile manufacturing worldwide. If AI infrastructure continues expanding rapidly, the sector could become another meaningful source of competition for a metal already critical to a wide range of industrial applications.
The $300 and $1,000 Silver Debate Returns
Against that tightening physical-market backdrop, bullish silver price forecasts have become increasingly aggressive. Michael Oliver has recently said he would not be surprised to see silver exceed his $300-per-ounce target and eventually move beyond $1,000 per ounce. (https://www.youtube.com/watch?v=lu-c1Ra6eAU)
The problem, according to the update, is less the possibility of extreme prices than the aggressive timelines attached to such forecasts. Oliver's call for $300 silver by the end of summer 2026 is highlighted as particularly vulnerable to criticism if the target fails to materialize on schedule.
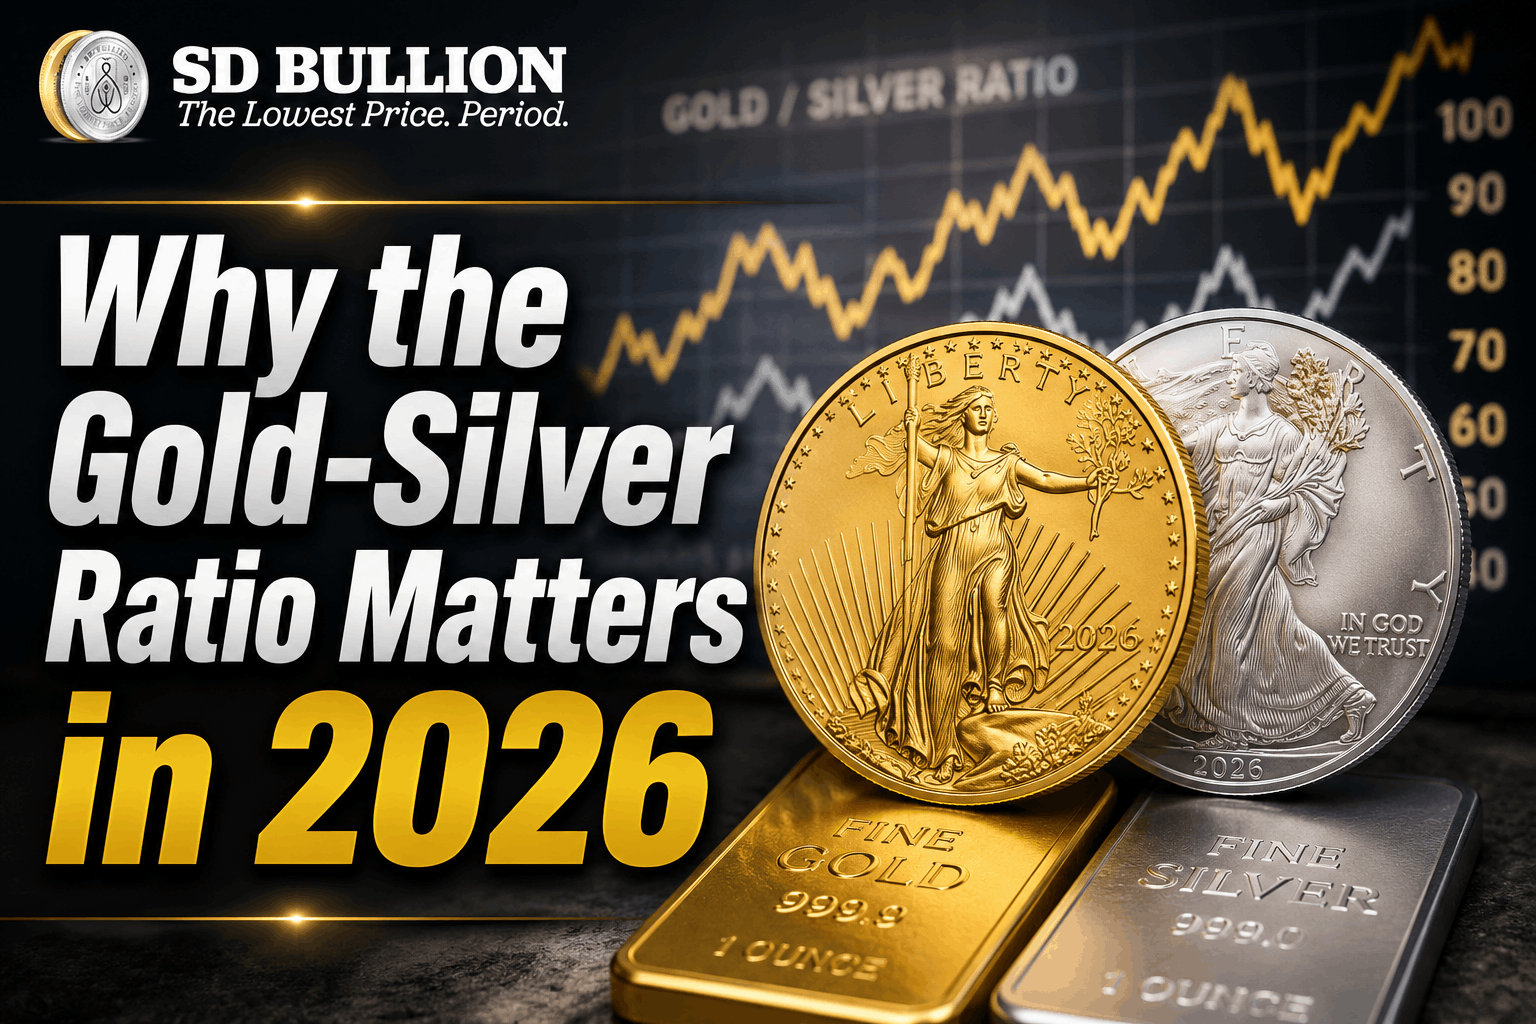
Rather than concentrating solely on nominal price targets, the update emphasizes what silver can purchase relative to other assets. The gold-silver ratio, for example, briefly reached the mid-40s earlier this year before rebounding, and the longer-term thesis presented is that the ratio could eventually return to—or fall below—its May 2011 low near 33:1.
Silver Versus Stocks and Real-World Assets
The same relative-value argument extends to equities. The S&P 500-to-silver ratio fell below 60 ounces in late January before rebounding to nearly 120 ounces. The author's longer-term thesis is that eventually just 20 ounces of silver could purchase the equivalent nominal value of the S&P 500 index, which closed the week at 7,785.
History demonstrates just how extreme those relationships can become. In early 1980, the ratio briefly fell to only 2.3 ounces of silver for the nominal value of the S&P 500. The update similarly argues that median-priced U.S. homes could eventually become considerably cheaper when measured in ounces of bullion.
A Longer-Term Case for Silver in the Hundreds
Ultimately, the update's silver thesis is not centered on predicting an exact nominal peak. Instead, it focuses on the possibility that silver's price relationship with gold and competing assets could dramatically change during a future precious-metals mania.
The document argues that historical price data show periods when spot silver and prices measured outside COMEX futures trading hours have reconverged, often while moving higher together for months or even years. The author believes another such convergence could eventually accompany substantially higher silver prices.
Importantly, the outlook is not presented as a one-year forecast. The author explicitly states that he does not expect the full move to happen within the next year, but is betting that over the next decade, record debt and unfunded liabilities across the Western world could help drive gold, silver and precious-metals derivatives into a far more volatile market environment.
Watch last week's full market update to review the charts behind these trends—including gold's breakout, China's and India's silver flows, historical gold-silver relationships, and the long-term price data driving the debate over where silver could ultimately go.
Source(s):
Gold Breaks Out of Its Summer Range | Bloomberg News sponsored by COMEX's CME Group
https://youtu.be/n2bVZ_G4bUM?si=a3b9t0fOXWaOO119