Silver demand is forecast to exceed supply by 46.3 million ounces in 2026, the sixth consecutive annual deficit, as total demand of 1,112.6 million ounces outpaces 1,066.4 million ounces of available supply. This structural imbalance is creating both challenges and potential opportunities for silver investors.
This guide examines the market fundamentals behind that imbalance, including silver production, industrial and investment demand, renewable energy, and supply constraints, to help silver investors understand the factors shaping the market in 2026.
Key Takeaways:
- Silver supply remains tight in 2026: Total demand is forecast at 1,112.6 million ounces versus 1,066.4 million ounces of supply, creating a sixth consecutive annual deficit as limited supply growth and relatively flat mine production constrain global availability.
- Industrial applications remain a major driver of silver demand: Solar panels, electric vehicles, electronics, AI, and data centers continue to drive demand, while clean energy technologies reinforce silver’s role as a strategic metal despite increased substitution.
- Investment and macroeconomic conditions can significantly affect silver prices: Geopolitical uncertainty, currency volatility, physical investment, and ETP inflows influence price action alongside industrial demand and other market fundamentals; silver reached a record $84 per ounce in December 2025.
- Silver offers several forms of investment exposure: Investors can choose physical bars and coins, exchange-traded products, or mining stocks, with mining-company performance also depending on annual production, operating costs, financing, and cash flow rather than silver prices alone.
Jump to: Introduction to Silver Market | Factors Affecting Silver Prices | Understanding Demand and Its Impact | The Role of Precious Metals | Characteristics of Precious Metal | Industrial Demand & Use of Silver | Silver Investment Opportunities | Renewable Energy and Silver | Persistent Deficits in Silver Market | Explore Physical Silver at SD Bullion | FAQs
Introduction to the Silver Market
The global silver market remains in a structural supply deficit in 2026, with global demand continuing to exceed available supply. The market recorded its fifth consecutive annual deficit in 2025, when demand reached 1,130.6 million ounces compared with 1,090.4 million ounces of supply, leaving a 40.3-million-ounce deficit.
The silver supply-demand imbalance is forecast by the Silver Institute to continue for a sixth consecutive year in 2026, with total demand of 1,112.6 million ounces expected to exceed 1,066.4 million ounces of supply, resulting in a projected 46.3-million-ounce deficit. Silver production, recycling, and investment demand will remain important supply and demand dynamics to watch as the market adjusts to constrained supply.
Silver consumption is also shaped by demand from industrial sectors and silver investors. Industrial growth, the energy transition, and solar deployment continue to support silver use, while coin and net bar demand is forecast to rise 18% to 257.6 million ounces in 2026, reflecting renewed interest in physical silver investment.
The table below shows how silver supply and demand have changed since 2017 and highlights the shift to persistent market deficits beginning in 2021.
| Silver Supply and Demand | ||||||||||||
|---|---|---|---|---|---|---|---|---|---|---|---|---|
| Supply | 2017 | 2018 | 2019 | 2020 | 2021 | 2022 | 2023 | 2024 | 2025 | 2026F | 2025 YoY | 2026F YoY |
| Million ounces | ||||||||||||
| Mine Production | 862.7 | 850.3 | 837.3 | 790.3 | 825.4 | 833.7 | 810.7 | 823.6 | 846.6 | 844.1 | 3% | -0.3% |
| Recycling | 160.9 | 163.2 | 164.7 | 181.5 | 191.8 | 194.6 | 184.6 | 194.5 | 197.6 | 211.3 | 2% | 7% |
| Net Hedging Supply | 0.0 | 0.0 | 13.9 | 8.5 | 0.0 | 0.0 | 0.0 | 0.0 | 44.7 | 10.0 | na | -78% |
| Net Official Sector Sales | 1.0 | 1.2 | 1.0 | 1.2 | 1.5 | 1.7 | 1.6 | 1.5 | 1.5 | 1.5 | 4% | -35% |
| Total Supply | 1,024.7 | 1,014.7 | 1,016.9 | 981.6 | 1,018.7 | 1,030.1 | 997.0 | 1,019.6 | 1,090.4 | 1,066.4 | 7% | -2% |
| Demand | ||||||||||||
| Industrial (total) | 528.0 | 525.8 | 525.4 | 511.9 | 564.1 | 592.3 | 657.1 | 679.0 | 657.4 | 639.6 | -3% | -3% |
| Electrical & Electronics | 339.1 | 330.4 | 326.7 | 321.4 | 350.7 | 370.7 | 444.4 | 460.9 | 449.5 | 422.9 | -2% | -6% |
| …of which photovoltaics | 99.3 | 87.0 | 74.9 | 82.8 | 88.9 | 118.1 | 192.7 | 197.5 | 186.6 | 151.0 | -6% | -19% |
| Brazing Alloys & Solders | 50.9 | 52.0 | 52.4 | 47.5 | 50.5 | 49.2 | 50.2 | 49.7 | 50.5 | 51.0 | 1% | 1% |
| Other Industrial | 138.0 | 143.5 | 146.4 | 142.9 | 162.9 | 172.4 | 162.6 | 168.4 | 157.4 | 165.7 | -7% | 5% |
| Photography | 32.4 | 31.4 | 30.7 | 26.9 | 27.7 | 27.7 | 27.3 | 25.5 | 24.2 | 22.5 | -5% | -7% |
| Jewelry | 195.0 | 201.9 | 200.3 | 150.2 | 181.0 | 233.2 | 201.7 | 205.1 | 189.3 | 159.4 | -8% | -16% |
| Silverware | 59.4 | 67.1 | 61.3 | 31.2 | 40.7 | 73.5 | 55.1 | 53.5 | 42.1 | 33.5 | -21% | -20% |
| Coin & Net Bar Demand | 155.6 | 166.1 | 188.1 | 209.0 | 285.3 | 339.5 | 244.2 | 190.9 | 217.7 | 257.6 | 14% | 18% |
| Net Hedging Demand | 1.1 | 7.4 | 0.0 | 0.0 | 3.5 | 17.9 | 11.5 | 3.5 | 0.0 | 0.0 | na | na |
| Total Demand | 971.5 | 999.7 | 1,005.8 | 929.0 | 1,102.4 | 1,284.1 | 1,197.0 | 1,157.4 | 1,130.6 | 1,112.6 | -2% | -2% |
| Source: Metals Focus, World Silver Survey 2026. | ||||||||||||
Factors Affecting Silver Prices
Silver prices are primarily affected by investment demand, industrial consumption, available supply, and broader macroeconomic and geopolitical conditions.
Because silver functions as both a precious metal investment and an industrial raw material, its price action can respond to changes in investor sentiment as well as shifts in global demand across industrial sectors.
Investment Demand and Market Conditions
Silver investment strengthened in 2025 amid geopolitical and macroeconomic uncertainty, favorable supply-demand fundamentals, and tighter physical market conditions. Silver’s 2025 price rally also occurred amid concerns over China’s silver export licensing rules and continued demand from green technologies, particularly solar photovoltaics.
According to the World Silver Survey 2026, coin and net bar demand increased 14%, while silver ETPs recorded estimated inflows of 68.3 million ounces. Against this backdrop, silver’s annual average price rose 42% year over year, reaching a record $84 per ounce in December 2025.
Industrial Demand
Industrial demand can affect silver prices by increasing competition for available supply, particularly when consumption grows faster than production.
However, the relationship works both ways: rising silver prices can encourage manufacturers to reduce silver loadings, improve efficiency, or substitute other materials, potentially moderating industrial demand.
Understanding Rising Demand and Its Impact
Silver demand is primarily driven by industrial applications and investment, with total demand forecast at 1,112.6 million ounces in 2026. Although this represents a 2% annual decline, demand is still expected to exceed available supply, contributing to a sixth consecutive market deficit.
Industrial demand remains the largest source of silver consumption. Oxford Economics identifies solar photovoltaics, electric vehicles, and data centers and AI as important areas for future silver use. For example, automotive silver demand is forecast to grow at a 3.4% CAGR from 2025 to 2031, reaching approximately 94 million ounces as EV adoption and vehicle electrification increase.
Investment and physical demand also vary across major silver-consuming markets. Coin and net bar demand is forecast to rise 18% to 257.6 million ounces in 2026, while ETF inflows provide another measure of investor interest.
Demand has also surged in some countries: India provides one example, emerging as the world’s largest importer of refined silver in 2025, with imports valued at approximately $9.2 billion. Rising prices and demand trends in other countries can further influence global investment flows.
The Role of Precious Metals
Precious metals such as gold and silver serve as investment assets, while silver also has extensive industrial uses that make its demand sensitive to both investor activity and industrial growth. This dual role distinguishes silver within the precious metals market and contributes to its unique supply, demand, and price dynamics.
According to the USGS Mineral Commodity Summaries 2026, silver is used in electronics, photovoltaics, coins and investment bars, jewelry, brazing and soldering, and other industrial applications. In the United States, electrical and electronics accounted for 25% of estimated silver use in 2025, while photovoltaics accounted for 15%.
Silver also responds to many of the same forces that influence other precious metals. The World Silver Survey 2026 identifies geopolitical uncertainty, U.S. dollar movements, interest-rate expectations, and investment flows among the factors influencing silver investment and price action.
Characteristics of a Precious Metal
Silver is a precious metal valued as both a strategic asset and an industrial material, with properties including high electrical conductivity, reflectivity, malleability, and ductility. These characteristics support its use in electronics, jewelry, silverware, coins, and other applications.
Silver also has a centuries-long track record as currency and a store of value and remains an investment metal today through physical silver bars and coins. Its safe-haven appeal can strengthen during periods of geopolitical risk, trade tensions, inflation concerns, and broader economic uncertainty, when investors may seek precious metals as stores of value.
One-ounce silver coins,rounds and 1 oz silver bars are among the most widely recognized formats, while larger bars, such as 5 oz, 10 oz, and 100 oz options, allow investors to purchase more silver per product.
|
Format |
Popular Sizes |
Typical Purity |
SD Bullion Considerantions |
|---|---|---|---|
|
Silver Coins |
1 oz |
Varies; many modern bullion coins are .999+ fine |
Government-minted; includes widely recognized options such as the American Silver Eagle and the canadian Silver Maple Leaf |
|
Silver Rounds |
1 oz |
Commonly .999 fine |
Privately minted and typically valued primarily for silver content |
|
Silver Bars |
1 oz, 5 oz, 10 oz, 100 oz |
Commonly .999 fine |
Available in multiple weights for investors seeking different amounts of silver bars per product |
Founded in 2012, SD Bullion is an A+ BBB-accredited precious metals dealer offering silver coins and bars across common sizes for investors seeking physical exposure to the metal.
Industrial Demand & Use of Silver
Industrial applications are forecast to consume 639.6 million ounces of silver in 2026, representing more than half of the 1.11 billion ounces of total global demand forecast by the Silver Institute. Silver is used extensively in electronics, solar photovoltaics, automobiles, EVs, charging infrastructure, AI, and data centers because of its electrical and thermal conductivity and corrosion resistance.
Although this represents a 3% year-over-year decline, demand remains substantial as silver use expands across AI infrastructure, data centers, EVs, and other advanced electrical applications.
Silver in Electric Vehicles and Electronics
In automobiles and EVs, silver is found in electrical contacts, battery management systems, inverters, charging components, sensors, and other electronics. Battery electric vehicles (BEVs) typically use approximately 25–50 grams of silver per vehicle, significantly more than traditional internal combustion engine vehicles.
Oxford Economics estimates that BEVs use 67% to 79% more silver than internal combustion engine vehicles, while automotive silver demand is forecast to reach approximately 94 million ounces by 2031.
AI, Data Centers, and Competing Industries
Silver is used across AI hardware and data center infrastructure in semiconductors, electrical contacts, switches, relays, connectors, solders, and thermal-management components. AI hardware such as GPUs and other specialized processors relies on silver-containing semiconductor connections and packaging.
The scale of this expansion is significant: Goldman Sachs Research forecasts global power demand from data centers to rise 165% by 2030 from 2023 levels, as companies build new AI-focused computing infrastructure.
Industrial silver consumption does not necessarily increase every year, even as AI, data centers, EVs, and other advanced technologies expand. Higher silver prices are encouraging thrifting and substitution, particularly in photovoltaics, illustrating how price, technology, and competing materials can reshape industrial demand.
Silver Investment Opportunities
Investors can gain exposure to silver through physical bullion, exchange-traded products (ETPs), and shares of silver mining companies, but each option carries different risks and potential benefits.
|
Silver Investment |
How It Provides Exposure |
Physical Ownership |
SD Bullion's Considerations |
|---|---|---|---|
|
Physical Silver Bars & Coins |
Direct ownership of silver bullion |
Yes |
Premiums, storage, insurance, liquidity, and silver price volatility |
|
Silver ETPs / ETFs |
Financial-market exposure to silver |
No direct possession |
Fund fees, structure, tracking, liquidity, and market risk |
|
Silver Mining Stocks |
Equity exposure through silver mining companies |
No |
Silver prices, annual production, operating costs, financing, cash flow, and company-specific risks |
Physical Silver
Physical silver bars and coins provide direct ownership of the metal, typically priced by the troy ounce plus a dealer premium. Many investors use physical silver for portfolio diversification, but potential risks include price volatility, storage and insurance costs, dealer premiums, and lower liquidity compared with some financial assets.
Physical silver is available in formats ranging from widely recognized 1 oz sovereign coins, such as the 1oz American Silver Eagle, to privately minted rounds and larger silver bars.
Physical investment, has recently increased substantially: the World Silver Survey 2026 forecasts coin and net bar demand to rise 18% to 257.6 million ounces in 2026, amid renewed investor interest. World Silver Survey 2026.
Investors considering physical bullion can track the current silver spot price through SD Bullion before comparing available coins, bars, and dealer premiums.
Silver Exchange-Traded Funds and ETPs
Silver exchange-traded products provide market exposure without requiring investors to store physical bullion themselves.
Silver ETF and ETP inflows can reflect changing investor sentiment and broader market dynamics. The Silver Institute expects global ETP holdings to increase by approximately 30 million ounces in 2026, following strong inflows in 2025.
Silver Mining Stocks
Silver-focused mining companies include Vizsla Silver and GR Silver Mining, offering exposure to silver exploration and development.
Global mine production reached an estimated 26,000 metric tons in 2025 across many countries, while silver’s addition to the 2025 U.S. List of Critical Minerals marked a potential turning point for its strategic importance.
Investors may also consider operational risks and responsible mining practices when evaluating mining stocks.
Renewable Energy and Silver
Solar photovoltaics remain a major source of industrial silver demand, with PV applications forecast to consume about 151 million ounces in 2026, according to the Silver Institute’s World Silver Survey 2026.
Silver's electrical conductivity, thermal conductivity, and corrosion resistance make it particularly useful in solar cells.
Silver powder is turned into a paste that is applied to silicon wafers. When light strikes the silicon, electrons are set in motion, and the silver conducts the resulting electricity for use or storage.
How Solar Panels and Clean Energy Technologies Drive Silver Demand
Global installed PV capacity increased more than tenfold over the past decade, while silver demand from photovoltaics roughly tripled, according to Oxford Economics and the Silver Institute.
Global solar capacity is forecast to grow at a 17% CAGR through 2030, supporting continued demand for materials used in solar deployment. However, the 2026 outlook is more nuanced. PV silver demand is forecast to decline 19% to 151 million ounces in 2026, as high silver prices accelerate thrifting and substitution with other metals such as copper.
Technologies such as Tunnel Oxide Passivated Contact (TOPCon) cells can require more silver than older Passivated Emitter and Rear Cell (PERC) technology, even as manufacturers pursue efficiency gains and lower silver loadings.
The chart below illustrates how the transition toward more silver-intensive photovoltaic technologies could widen the gap between silver supply and combined demand through 2030, particularly as solar competes with electronics, automotive, and other industrial sectors for available metal.

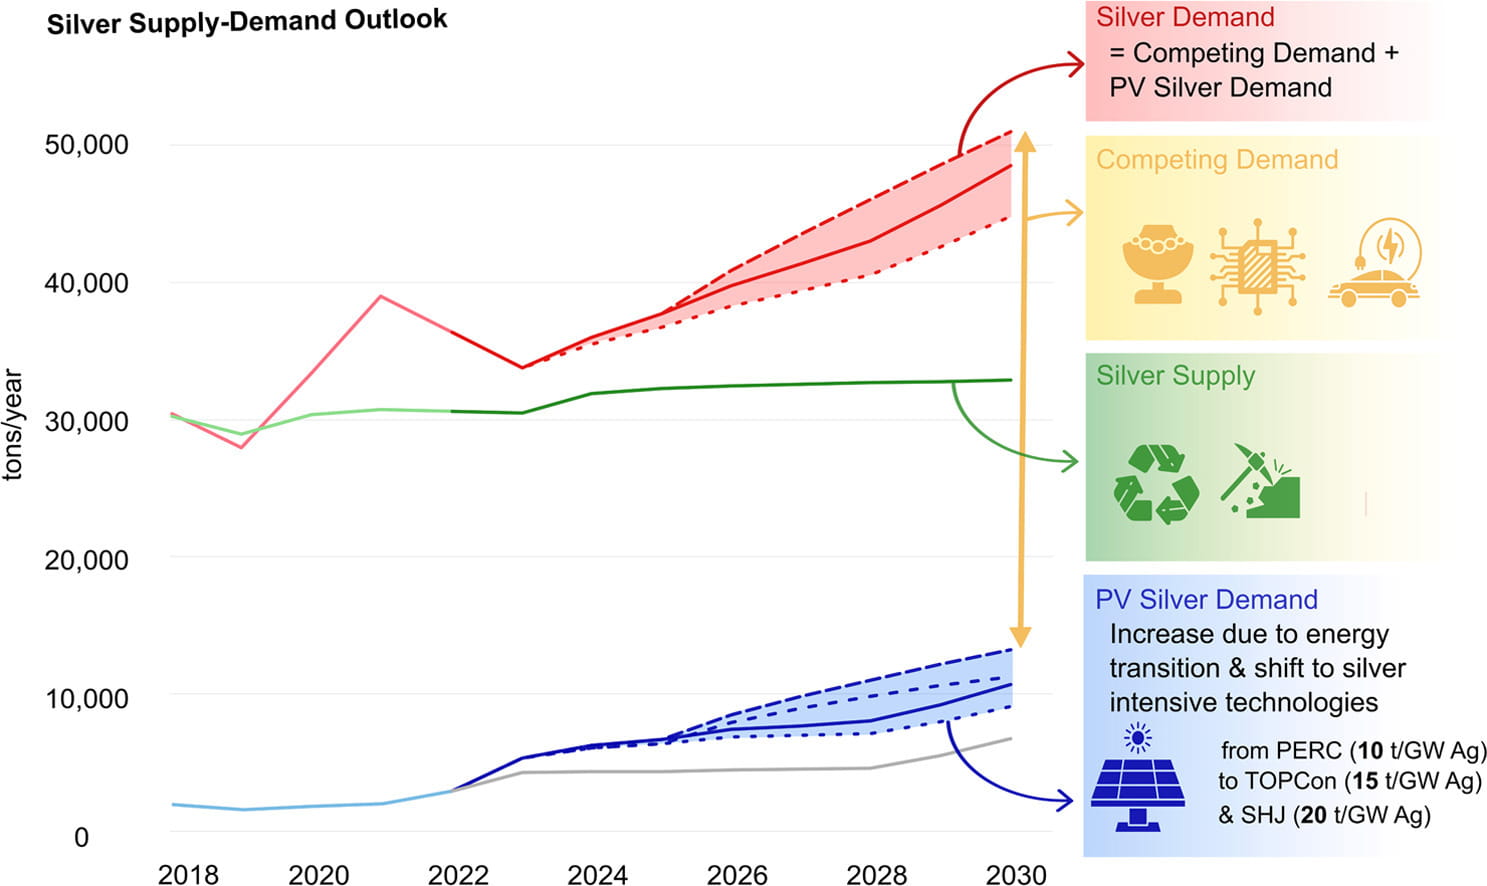
Image Source: “Forecasting silver demand and supply by 2030: Impact of silver-intensive photovoltaic cells and sectoral competition”, Resources, Conservation and Recycling (2026).
The energy transition remains an important long-term demand driver, but growth in solar deployment does not translate directly into equivalent growth in silver consumption because technological changes affect the amount of silver used per cell.
Persistent Deficits in the Silver Market
The silver market is forecast to remain in deficit for a sixth consecutive year in 2026 because available supply continues to fall short of demand. According to the World Silver Survey 2026, 2026 is forecast to mark the sixth consecutive annual deficit, at 46.3 million ounces, bringing the cumulative shortfall since 2021 to 762.1 million ounces.
China’s tightening of silver export controls has increased attention on silver as a strategic resource in global supply chains. Reuters reported that only 44 companies are authorized to export silver from China in 2026 and 2027, raising concerns about future global availability, although actual restrictions on silver shipments had not emerged as of January 2026.
The silver market recorded its largest deficit of the past decade in 2022, when demand exceeded supply by approximately 254 million ounces.
Why Is Silver Supply Growth Limited?
One constraint on global silver supply is limited mine supply growth. Global output peaked at roughly 900 million ounces in 2016 and has remained below that level, with mine production reaching 846.6 million ounces in 2025 and forecast at 844.1 million ounces in 2026.
As with gold, Chinese silver mine production has increased substantially in recent years, although Mexico remains the largest source of silver mine supply.
Much of the world's silver is also produced as a byproduct of mining other metals, limiting how quickly mining companies can increase silver output solely in response to rising silver prices. New silver mines can also take more than a decade to reach commercial production due to exploration, permitting, financing, construction, costs, and environmental review requirements, further limiting how quickly new supply can enter the market.
Recycling and Available Silver Supply
Silver recycling is forecast to increase 7% to 211.3 million ounces in 2026, but the additional recycled metal is not expected to eliminate the supply deficit. Total available supply is projected at 1,066.4 million ounces compared with demand of 1,112.6 million ounces.
Persistent deficits can contribute to tighter physical markets and greater price volatility, but they do not guarantee rising silver prices. Price action also depends on investment demand, macroeconomic conditions, and other market fundamentals.
Explore Physical Silver at SD Bullion
Investors interested in physical silver can explore SD Bullion’s selection of silver coins, rounds, and bars in a range of weights and formats. Compare available products, premiums, and the current silver spot price before deciding which form of physical silver fits your investment strategy.
-
Disclaimer: This content is for informational and educational purposes only and should not be considered financial or investment advice. Precious metals and related investments involve risk, and past performance does not guarantee future results.
Is silver a good investment in 2026?
Silver may present investment opportunities in 2026 as the market enters a sixth consecutive supply deficit and coin and bar demand is forecast to rise 18%. However, the projected 46.3-million-ounce market deficit does not guarantee rising prices. Silver remains volatile, and investors should weigh their risk tolerance when considering physical bullion, ETPs, or mining stocks.
Why is silver in a deficit?
Silver is in a deficit because demand continues to exceed available supply while mine supply struggles to grow quickly. In 2026, demand is forecast at 1,112.6 million ounces versus 1,066.4 million ounces of supply, creating a projected 46.3-million-ounce market imbalance and extending the deficit for a sixth consecutive year.
How much silver is in an EV?
Battery electric vehicles typically use approximately 25–50 grams of silver per vehicle. Oxford Economics estimates that BEVs use 67%–79% more silver than internal combustion engine vehicles, with silver used in electrical contacts, battery management systems, inverters, sensors, charging components, and other electronics.