Gold & Silver Sharp Selloff as Markets React to War, US Debt, and Energy Shock
- Gold and silver prices saw a sharp selloff this week, with gold dropping over $500 per ounce in one of its biggest weekly declines in decades.
- Despite the drop, silver remains strong compared to last year, still trading at roughly double its price from March 2025.
- The volatility is being driven largely by escalating geopolitical tensions, including potential U.S. military involvement in Iran and rising energy market disruptions.
- Energy prices are surging rapidly, fueling inflation expectations and pushing bond yields higher, with the 10-year Treasury nearing 4.4%.
- U.S. debt has surpassed $39 trillion, with no realistic path to balanced budgets, reinforcing long-term concerns about currency debasement.
- Analysts note that sharp pullbacks like this are common in bull markets, where prices can retrace up to 50% before continuing higher.
- Technical indicators suggest gold could fall further toward its 200-day moving average, while silver may test lower support levels in the near term.
- Physical demand remains strong, particularly in China, where silver imports have surged and inventories across major exchanges are declining.
- Industrial demand—especially from solar manufacturing—along with investment buying is tightening global silver supply.
- The broader outlook for precious metals remains bullish, with expectations of renewed monetary easing and continued inflation pressures supporting long-term demand.
Sharp selloff in precious metals unfolds alongside surging U.S. debt, rising energy prices, and strong Chinese demand—raising questions about how deep this pullback could go before the next bull run resumes.
The spot price of gold fell by over $500 per oz this week, the largest percentage drop since 1983.
Silver was not spared in this week's precious metals price selloffs. Closing the week, the silver spot price was about twice what it traded at this time last year, in late March 2025.
Later in this week's Bullion Market Update, we'll look at price action history to get a sense of where the bottom might be for both gold and silver.
The silver and gold markets sold off sharply this week.
The spot silver price ended the week at $67.79 oz bid.
The spot gold price closed the week basically flat at $4491 oz bid.
The spot gold silver ratio rose to close the week at 66.
The bottom line for bullion bulls the world over is this.
It's common in bull markets for bullion to see price retracements of up to 50% before resuming its bull climb.
For those kicking themselves at the beginning of the year for not having bought enough bullion, the opportunity again exists for investors to position near the ground floor of where this year started.
Name any major debasing full fiat currency pair, and the opportunity now exists to acquire silver bullion at prices you would have been pleased to have bought at only a few months ago.
The current crisis in energy markets suggests the central planners will begin another round of quantitative easing and rate cuts to keep the world economy from imploding.
You'll want to have your bullion positions settled before the next bull market move gets going again in earnest.
The spot price of gold fell by over $500 oz this week, the largest drop in percentage terms since 1983.
Silver was not spared in this week precious metals price selloffs. Closing the week about twice the spot price it was trading at this time last year.
The selloff in silver over the last few weeks has been one for the percentage markdown record books akin to gold.
Macro analysts Luke Gromen stated the price volatility in fiat US dollar gold is reminiscent of 1920s Germany, given our present context it makes sense to him.
The amounts of crude oil exports lost over the last month and into the foreseeable future are surely going to have dramatic growing effects.
Luke is now banging the table over how dramatic outcomes from this war will become.
We are now seeing reports that The Pentagon is preparing plans for a possible US ground force deployment in Iran. Concerns about mission creep with troops from a key energy Iranian island, to the coast, to the Iranian mountains grows.
Late today following the CBS news article, President Trump claimed the US is 'considering widening down' the Iran war.
Conflicting statements aside, the price for energy continues to climb at unprecedented pace vs the last five and a half decades of data.
It is no surprise to see growing developing economies like India announce this week their intention to quadruple their solar panel capacity over the next decade.
Expectations for climbing price inflation have more than doubled, with the market expecting the breakeven rate of interest now to be just over 5%.
It is no surprise to see rates on bonds climbing across the board, the 10 year now yielding near 4.4%.
The onshore fiat US dollar M2 supply continues growing to record high levels with an aggressive upward trajectory ongoing.
US hard debt levels have already officially passed $39 trillion to close this week.
There is no sign nor chance for balanced budgets in our foreseeable future.
Matter of fact conservative estimates suggest US budget deficits from here to as far as we can get away with them.
The US Congressional Budget Office stating that the US debt level is on trajectory to rise to historically unsustainable levels.
The rate things are going we'll likely look back on these estimates as highly understated.
Fundamentally the base case for an aggressive position in bullion and precious metals hasn't changed. merely a lot of recent volatility in spot prices is what we are seeing.
We'll look at "Where the bottoms might be?" along with further evidence that the Eastern world's bid for bullion has only been growing of late.
The silver and gold markets sold off in a big way this week.
The spot silver price ended the week at $67.79 oz bid.
The spot gold price closed the week basically flat at $4491 oz bid.
The spot gold silver ratio rose to close the week at 66.
The spot gold price has pierced and closed below it 100 day moving average, and the question remains will is go down to touch its ongoing 200 day moving average now near $4080 oz.
That is basically another -10% move downward from here, and is typical to see during bullion bull market consolidation phases.
On the silver side of its ongoing moving averages, we'll see next week if the $64 low will be taken out, with the current 200 day moving average for silver slightly above $57 oz.
A quick eyeball of the silver chart, these are the key levels if and in a further downturn.
Backwardation in the Chinese SHFE continues, and local premiums for silver bullion above Western world price points continue.
Inventory levels of industrial silver supplies in China's SGE & SHFE fell below 20 million oz this past week.
Reports of Chinese buying the gold price dip this week suggest high demand for gold bullion bars from investors of late.
Bloomberg reported this week on the large growth of silver bullion buying by the Chinese to start Q1 2026.
We are seeing larger import figures for silver for both mainland China and through Hong Kong over the past few months.
Silver bullion buying in China hit eight year high levels to start this year feeding a combination surge in both industrial and investment demand.
Premiums paid for silver have been persistently well above Western world price points.
As industrial silver warehouse supplies have collapsed due to silver for solar cell manufacturing and retail investment demand rising.
The trend of collapsing silver warehouse inventories is not merely a Chinese phenomenon.
Bloomberg pointed out both London and COMEX supplies have been hitting multiyear low levels.
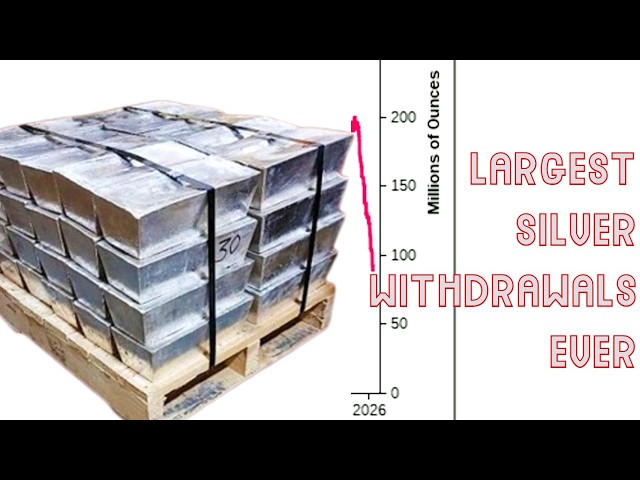
Selloff in mostly Western world silver ETFs have allowed London lease rates to fall over the past few months. For instance over the past 40 days, over 30 million oz of silver has been withdrawn from the unsecured silver ETF SLV allowing London some breathing room for the time being.
Bloomberg' Yihui Xie wrote the following:
China’s ravenous appetite for silver lifted overseas purchases to an eight-year high at the start of 2026, as importers fed a surge in industrial and investment demand.
The world’s biggest buyer pulled in over 790 tons in the first two months, including nearly 470 tons in February, the highest ever for that month, according to Chinese customs data on Friday. Strong demand has pushed local prices well above international benchmarks, whittling down already-low exchange stockpiles and hoovering up metal from abroad.
China’s lofty imports have yet to disrupt the London market, thanks to a record inflow of silver into the global trading hub following an historic squeeze last year. Less silver held in exchange-traded funds around the world, which have dropped this year by more than 1,900 tons, has also freed up more metal.
Visible inventories tracked by major exchanges from New York to Shanghai are either falling or sitting well below their long-term averages, suggesting metal remains scarce in the broader system. And the market has reason to be worried.
The bottom line for bullion bulls the world over is this.
It's common in a bullion bull market to see retracements of up to 50% before renewing the bull climb.
For those kicking themselves at the beginning the year for not having bought enough bullion, the opportunity again exists for investors to position near the ground floor of where this year started.
Name any major debasing full fiat currency pair, the opportunity now exists to acquire silver bullion at prices you would have been pleased to have bought at only a few months ago.
The current crisis in energy markets suggests the central planners will begin another round of quantitative easing and rate cuts to keep the world economy from imploding.
You'll want to have your bullion positions settled before the next bull market move gets going again in earnest.
SOURCE:
China Pulls Silver From Global Markets to Meet Surging Demand
archive.is/142LX