Global Energy Shock and U.S. Rising Debt Put Gold and Silver Markets in Focus
- Gold and silver prices retreated over the past week, with spot silver closing at $80.57 per ounce and spot gold ending at $5,019 per ounce, while the gold-silver ratio rose to 62, indicating gold slightly outperformed silver during the pullback.
- Investor selling pressure appeared in paper markets, as recent price declines triggered liquidations in gold and silver ETFs and ETPs, including notable selling by Indian investors.
- U.S. fiscal deficits continue to balloon, with more than $1 trillion already accumulated five months into the fiscal year, and total national debt approaching $38.9 trillion, making $40 trillion by year-end a realistic projection.
- The escalating U.S.–Israel–Iran conflict has triggered a historic energy shock, with the effective closure of the Strait of Hormuz disrupting roughly 20% of global oil flows, creating the largest energy supply shock on record.
- Oil prices surged amid the disruption, with WTI and Brent crude trading around $95–$100 per barrel, and physical market premiums in some regions reportedly reaching up to 40% above futures prices.
- Energy inflation is spreading through the global economy, with jet fuel prices in New York more than doubling and fertilizer prices reportedly jumping over 77%, signaling rising costs across transportation and agriculture.
- Market tensions have raised concerns about government intervention, after CME Group CEO Terry Duffy warned that attempts to suppress oil prices through derivatives markets could trigger a “biblical disaster” by undermining market confidence.
- Central banks continue to accumulate gold, with the Czech Republic and Poland recently adding bullion reserves, reinforcing the global trend of shifting from sovereign bonds toward hard assets.
- Global silver trade flows are rapidly shifting, including Turkey importing a record 360 tons in February and large movements of silver from the U.S. to London as tight lease markets pull metal overseas.
- Eastern silver markets remain structurally tight, with Chinese inventories falling to around 20 million ounces and prices trading roughly 13% above Western exchanges, reinforcing the view that global silver prices could eventually move significantly higher.
Oil supply disruptions, mounting U.S. deficits, and tightening global silver inventories are reshaping commodity markets as gold holds above $5,000 and investors reassess risk in an increasingly volatile geopolitical environment.
Last Week Gold and Silver Prices:
The spot silver and gold prices traded down on the week.
The spot silver price closed at $80.57 oz bid.
The spot gold price ended the week at $5,019 oz bid.
The spot gold silver ratio ended this week upward at 62.
War-Driven Oil Supply Crisis Ripples Across Global Markets
The effective closure of the Strait of Hormuz buttressing Iran is disrupting roughly 20% of global oil production and other critical industrial inputs the world over.
This is by data definition the largest physical supply shock the energy market has ever faced.
Since the end of last month, intraday crossing have basically dropped to zero.
In terms of world oil crossing chokepoints this is a big deal as so much of the middle east's refining and industrial outputs use the sea lane like a highway to ship products.
The left half shows millions of barrels per day output Saudi Arabia, Iraq, UAE, Iran, Kuwait, and Qatar.
The right half are the major consumers for the oil output led by China, then India, other Asian countries, South Korea, Japan, with the EU and USA making up the smaller points of destination.
Apparently Iran is now considering allowing tankers through which have paid in Chinese yuan. Accentuating the point that much of this war in underlying payment settlement battles ongoing.
And yes while Asia is often the destination of these goods, the closure of the strait has jacked prices up in many energy related commodities worldwide. Everyone is affected regardless.
Here for instance is jet fuel prices in NY, more than doubled in price.
Reports of fertilizer for food production prices going up by over 77% of late.
Not merely a story on oil, it also a story about rising natural gas prices.
The two are the majority energy inputs for most of the world's largest developed economies.
Both in terms of millions of crude oil barrels per day and world supply percentage terms, this event is the largest in historic records.
The effect on crude oil prices to close this first quarter of 2026 has been dramatic with futures driven Brent and WTI both closing the week each side of $100 per barrel.
The dark thin line at the bottom of this chart is the 50 year price average which is typically +10% per year. Oil is already over 70% on the year with today's high price closes.
Older viewers might be reminded of the 1974 and 1979 oil crisis.
In 1974 the world saw a quick tripling of the oil price, then in 1979 and effective doubling again of the price for a barrel of crude.
And while financial screens suggest the closing price for a barrel of oil was around $100 this week. The truth in many parts of the world is that premiums upwards of an additional 40% are now the local market asking price for physical settlement.
The blue line is mostly derivatives, the white line is reality on the ground in Dubai for instance.
One of the more ironic news related items of the week was the head of Comex Nymex CME Group CEO Terry Duffy publicly warning the US Treasury or any governments to not attempt to lower prices using derivatives.
For in doing so it would erode confidence somehow further risking a 'biblical disaster' if markets like the CME became unable or less effective at setting the price of critical commodities.
Take the ongoing gold price for example.
When the COMEX gold futures market was founded to start 1975 with the express intention to invest price volatility in the day to day discovery of gold prices on it leveraged exchanges, the then price of gold to begin 1975 was $175 oz.
Throughout the last 56 years of time, the price of gold trading during COMEX intraday-hours has only risen to $529 oz. Yet the world's current physical gold bullion price is nearly ten times what the COMEX's ongoing data might suggest the price of gold would be according to their intra-hour trading over a half century.
The bottom line is the world's derivative price discovery markets are having a harder and harder time suppressing prices for critical commodities and store of value monies. It's a shame this latest war is making these facts more obvious to anyone with eyes to see these truths.
Gold Stays Elevated While Silver Volatility Grips Bullion Markets
The spot silver and gold prices traded down on the week.
The spot silver price closed at $80.57 oz bid.
The spot gold price ended the week at $5,019 oz bid.
The spot gold silver ratio ended this week upward at 62.
Five months into the US fiscal year through last month February, the US government has over $1 trillion in deficit ongoing. This data is only through the end of last months so Iran war expenses are not fully reflected yet. US Debt to the Penny website shows US debt is now $38.9 trillion so $40 trillion by the fiscal year end is an easy projection.
The Czech and Polish central banks both recently announced adding more gold tonnage to their reserves, signaling even European nations are moving further into the bullion over bonds trade.
Recent gold and silver price pullbacks have produced some selloffs especially in ETFs and ETP markets.
Even Indian investors have sold off some of their recent net gold and silver ETF positions.
Turkey imported another record amount of silver last month, nearly 360 tons or 11.5 million oz in Feb 2026.
A country suffering under persistent fiat Turkish lira inflation buying silver both for refining and store of value purposes increasingly so is no surprise.
US import data from January 2026 during silver's historic price rise shows the US imported near 240 tons of silver, mostly from Mexico. In in that same month exporting nearly 1600 tons or over 50 million oz, most headed to the UK as lease rates in London were exorbitantly high.
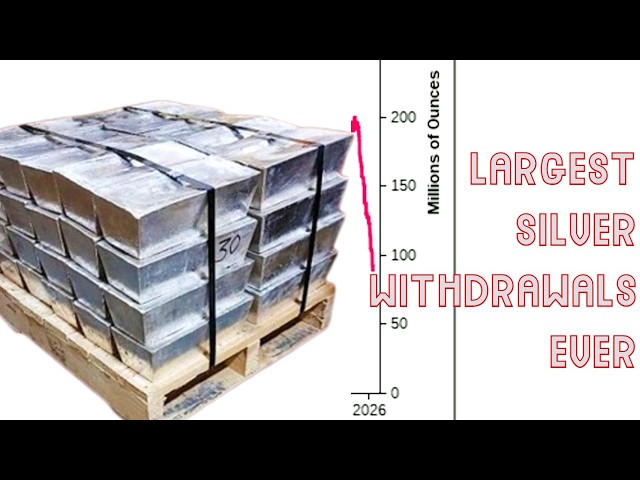
Piles of silver that once flowed to the US for fear of Trump administration tariffs have upped and vanished nearly 200 million oz outflowed in less than a half year.
Global Silver Shift: Exchange Stocks Fall as Asia Draws Supply
Meanwhile silver inventories in China fell to merely 20 million oz in the middle of this week, with the SHFE seeing a more than 2 million oz inflow to end the week.
The Chinese silver market is still in backwardation and has been that way for over a month and a half.
Premiums for silver in China are still hovering +13% above the western world exchanges.
It was less than two years ago on this channel I showed you this incoherent eastern vs western world silver price discovery data. Back when spot silver was just below $30 oz.
And pretty much ever since the silver spot price has been moving towards what Eastern world silver price data.
I maintain using this data, the market clearing price point will eventually be, nearly five multiples higher than this week's closing spot price.
Source:
US intervention in oil futures would be ‘biblical disaster’, CME warns
https://archive.is/gYBq6