Central Bank Gold Buying to Break Records Again in 2026
- Gold and silver prices surged this week, with spot gold climbing $100 to close near $4,714 per ounce while silver continued its advance, underscoring intensifying investor demand for hard assets amid mounting geopolitical and monetary instability.
- The gold-to-silver ratio slipped to 58, a level analysts view as technically significant, suggesting silver may be entering another phase of outperformance relative to gold and broader financial markets.
- Despite the S&P 500 reaching fresh nominal highs above 7,400, valuation metrics remain historically stretched, with comparisons increasingly drawn to the 2000 dot-com bubble and prior speculative peaks.
- Measured in silver, the S&P 500 still trades at roughly 92 ounces of silver per index share, a level far above historical bear market bottoms, reinforcing the view that precious metals remain undervalued versus equities.
- Supply risks in the silver market intensified after China restricted sulfuric acid exports and disruptions tied to Middle East conflict threatened refining operations critical to global silver byproduct production.
- Additional strain emerged following an explosion at Glencore’s Kazzinc refining facility in Kazakhstan, a major supplier of 1,000-ounce silver bars that back holdings in the world’s largest silver ETF, SLV.
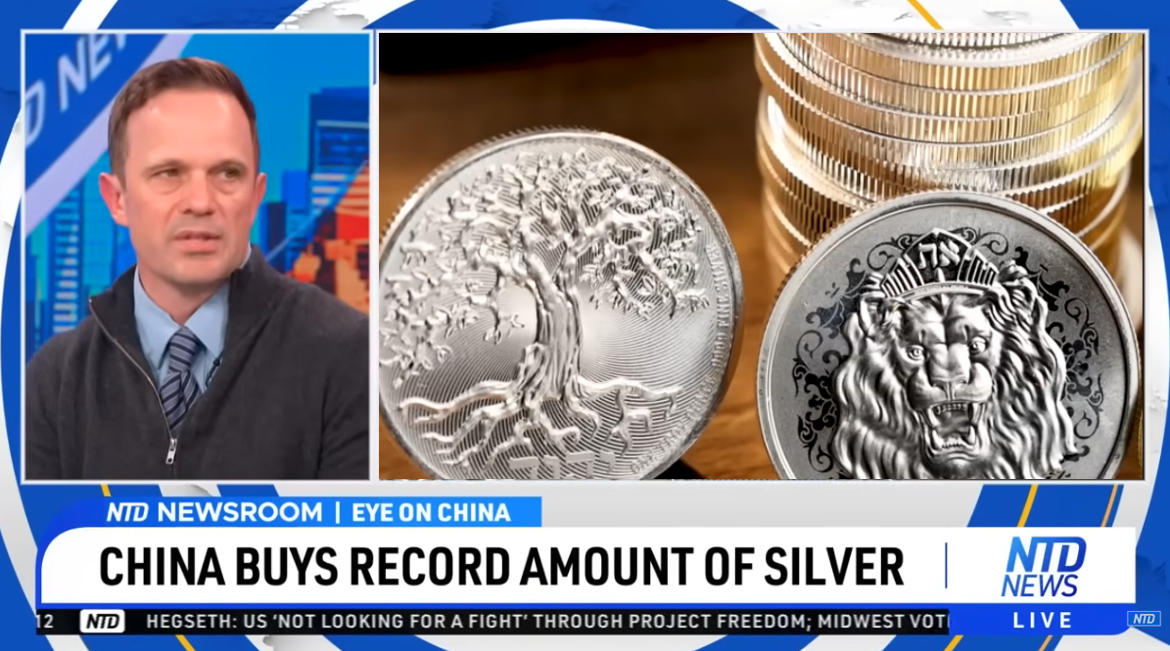
- Physical precious metals demand in China remained robust, with domestic silver prices hovering near $90 per ounce and Shanghai warehouse inventories continuing to absorb large volumes of industrial silver.
- Poland resumed aggressive gold reserve accumulation while China added more than 8 metric tons of gold in April 2026, extending Beijing’s official gold-buying streak to 18 consecutive months.
- The report argues that China and Russia appear to be strategically mirroring one another’s official gold reserve growth, with both nations now reportedly holding more than 2,300 metric tons of gold reserves.
- Central bank gold purchases are on pace to set another record in 2026, with estimated buying of 850 metric tons at roughly $5,000 gold translating into unprecedented fiat-dollar demand as nations increasingly diversify away from Western financial systems.
Surging geopolitical tensions, tightening silver supplies, and aggressive gold accumulation by China and other nations are reshaping global precious metals markets as investors brace for deeper cracks in the financial system.
Last week's market update on Gold and Silver
The silver and gold markets were both up on the week.
The spot silver price climbed to close at $80.34 oz bid.
The spot gold price climbed $100, closing this week at $4,714 oz bid.
The spot gold silver ratio coil is now threatening a possible breakdown lower, closing this week at 58.
The nominal S&P 500 clipped 7400 this week and stock bubble bulls celebrated.
On a Price to Earnings 10 year average only the prior 2000 internet stock bubble ever peaked higher. Generally after such stock market bubbles come and go, we witness stock bear markets than can endure for a decade or longer.
I mentioned in the interview that the S&P 500 measured by silver is still historically high closing at about 92 oz of silver to afford one nominal share of the S&P 500 currently.
That level is still well higher than the peak seen in 1929 or the nifty 50s stock market bubble of the 1960s.
The blue line of 59 is where we bottom ticked at the end of Jan 2026 when spot silver neared $120 oz but since this is a monthly chart normie onlookers would not notice is that we have already broken sub 60 oz and are merely consolidating gains before the next silver bullion outperformance vs US stocks to come.
My longer term target of 20 oz buying the S&P 500 is merely in line with what investors lived through fro decades following 1929 and the late 1960s. Picture a more humble future world that actually has to produce shareholder value instead of fiat financialized hype, share buybacks, and accounting gimmicks.
Similar story but less pronounced story measuring the current S&P 500 by Gold bullion, it ended the week at 1.57 oz of gold to afford the nominal record high S&P. Right around the same peak as 1929 and well above 1 to 1 parity which is often a brief stopping point before lowering much further down during typical commodity bull markets that follow stock market bubbles.
A half ounce of gold bar being able to buy the S&P 500 is a pretty conservative longer term target into next decade. Of course what is happening with our nation's fiat currency and the world at large when that time comes, still highly questionable with so much debt and unfunded liabilities to come.
This month's ban of Chinese sulfuric acid exports and the lack of supplies thanks to the Iran Wars halting trade is building a messy situation not merely with food fertilizers but also in the refining of silver related base metal refining for the like of copper and zinc worldwide.
Silver supply mostly comes from a combination of copper and lead/zinc mining and sulfuric acid is a key component for many silver bi-product producing miners. Get ready to see lower outputs of silver supplies to come given the shortage or sulfuric acid supplies.
Sad news this week with an explosion at Glencore's Kazzinc refining facility in Kazakhstan which led to the death of 2 people while injuring 5 others. Reports are the destruction was contained to one refining building.
The Kazzinc 1,000 oz Silver Bar hallmark is by far the largest single 1,000 oz bar brand backing the world's largest unsecured silver ETF SLV with nearly 18% of the entire reporting underlying bars being from that zinc refiner.
After this brief message we'll be back with a more precise and relatively accurate way to think of central bank gold buying ongoing and growing. We'll be right back.
The price for silver in China is still hovering near $90 oz, price premiums locally for platinum and palladium remain also elevated relative to Western World price benchmarks.
The combined SHFE and SGE warehouses have been sucking silver into their warehouses now holding 45.5 million oz to end this week. Basically that's enough industrial silver to cover about 1.5 years of their nation's world lead car manufacturing production. It's still not all that much relatively speaking.
The central bank of Poland is back buying gold reserve tonnage seemingly hellbent on growing towards its 700 ton target.
China added just over 8 tons over 250,000 oz in last month April 2026, adding gold reserves for the 18th month in a row.
Allow me to put their last 18 months of bullion buying into 21st Century context.
I remain convinced that China and Russia have had an agreement to mimic one another official gold reserve holdings going all the way back to the 2008 GFC where China led with large one time additions in 2009 and 2015, then Russia ran with the gold reserve stacking baton the late 2010s, and now China in the 2020s has been slowly accumulating to match the both nations now having just over 2,300 metric tons of gold reserves respectively to date.
Of course they both have other holdings off official balance sheet using SWF and internal bank holdings, it is that opacity require precious metal data hounds like myself to constantly keep on top of their import export and internal mining data to garner a truer idea of what their real gold holdings are likely to climb to in time.
You have seen this 21st Century physical gold flow chart before, India and China dominate the world's gold demand at large.
Well we now have similar physical silver flow data for this 21st Century that once again illustrates that both industrial powerhouse China and India are both silver market giants in the eastern world.
These physical flows reflect for every 3 oz of silver heading east 1 oz of gold has also flown thus far in the 21st Century.
To close this week, I want to remind everyone when financial media show historically record high central bank gold reserve buying since the year 2022 to not merely consider the unprecedented amounts they are actively buying in overall weight terms.
What is as important to consider how much buying is happening in fiat currency terms.
If we simply assume an 850 ton estimate this year at $5000 oz gold, we see in fiat US dollar terms the collective central bank buying is growing year after year since the freeze of Russian assets and now with this Iran War and world trade flow breakup, who thinks this growing record high gold buying trend is going to reverse anytime soon?
That will be all for this week's bullion market update.
Source:
We Are Looking at a Future With Higher Silver Prices: Precious Metals Analyst
https://youtu.be/D_OQEV2EaTM?si=Qk0Sj90KLnM392B0