

 |
 |
 |
 |
Share our original content for free using these guidelines:
– Please link back to the original source here
– Please provide attribution to “SD Bullion”
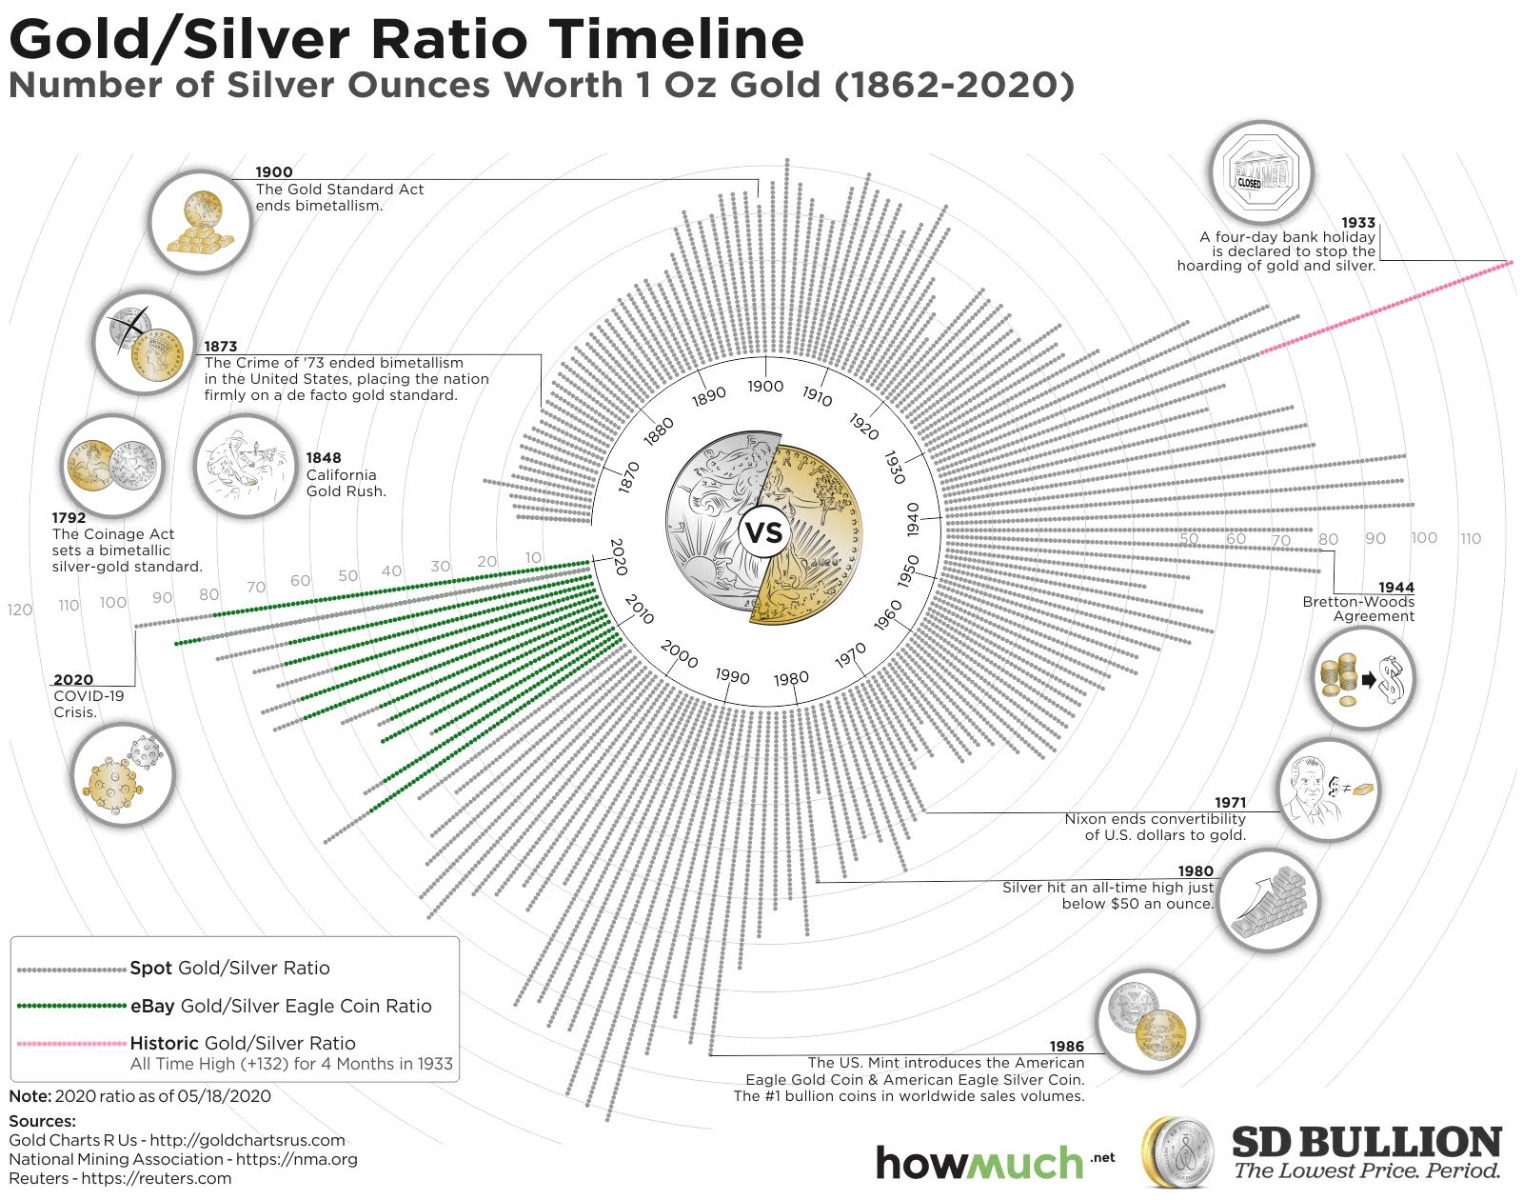
This gold vs silver value chart illustrates the Gold Silver Ratio for over 158 years of time.
Each year in our round shaped Gold Silver Ratio Chart is represented by a certain amount of dots. These dots represent the ounces of silver worth 1 oz of gold (GSR). The value for each year is the latest value available for that year, and the years advance in a clockwise direction.
Born by a thorough Silver Price History research, the Gold Silver Ratio graph tells us much about our financial and economic history.
It portrays comparative values in the United States of America for gold versus silver starting in the year 1862 (back during the Civil War and the greenback era). By the “Crime of 1873”, the value of silver versus gold began to generally fall in value by law and fiat decree. This Gold Silver Ratio Chart’s data is updated until May 18, 2020.
This image also has an added green-color date set that helps illustrate the recent ongoing eBay American Gold Eagle vs Silver Eagle Coin sales ratio. The difference between the gray colored Spot Gold vs Spot Silver Ratio and this most popular gold silver coin sales ratio reflects market-driven bullion premiums versus ongoing spot price disparities spanning the years 2008-2020.
- TOP 10 BULLION PRODUCT COUNTDOWN -
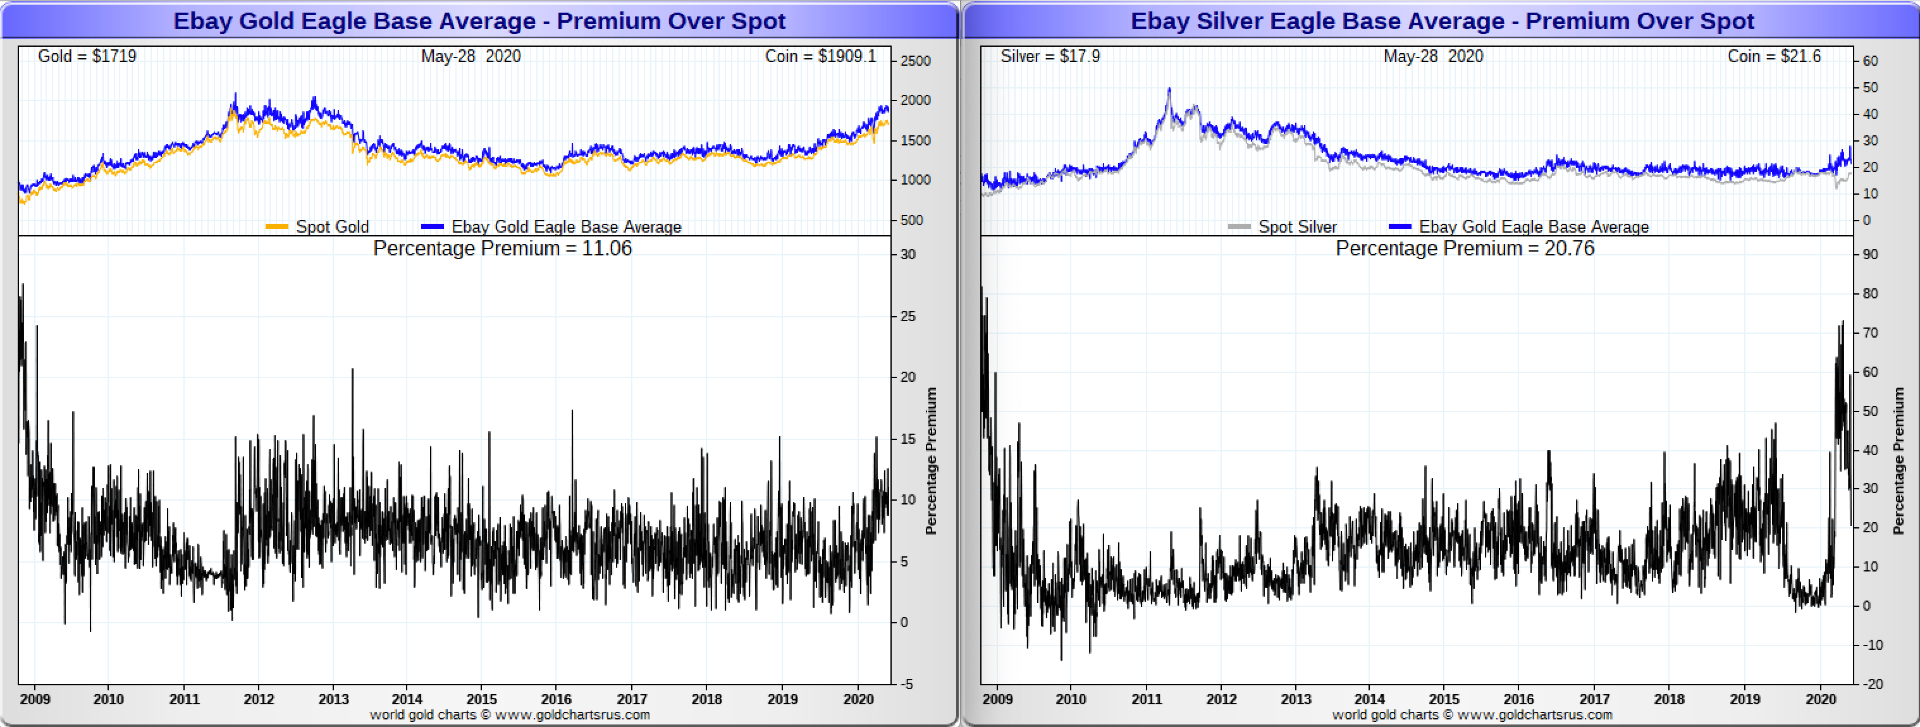
In the Gold vs Silver Eagle eBay price premium chart above, you can see how both gold and silver US Mint bullion coin price premiums have risen over the past few months during this viral COVID economic lockdown.
Throughout recent years 2016 through 2019, many secondary bullion products were sold back into the bullion industry compressing then price premiums while also damping new coins sales data year over year.
You can see that in our round Gold Silver Ratio Chart in the year 2019’s green vs gray data line for instance. The green colored American Gold Eagle vs American Silver Eagle ratio actually eclipsed the spot driven Gold Silver Ratio. This was likely due to how many secondary products were for sale on the market at the time with less demand back then versus now in 2020.
2020 Bullion Shortage vs 2008 GFC Bullion Shortage
During tight bullion shortage eras (e.g. fall 2008 bullion shortage) when investor bullion demand overwhelms available bullion supplies for sale, we see a phenomenon
For instance, depicted in our round Gold Silver Ratio Chart in green above, the most often purchased 1 oz American Gold Eagle Coin vs Silver Eagle Coin by eBay sales data, diverges sharply from the futures and spot market-driven GSR.
This is a sign that both wholesale and retail physical bullion demand is going the opposite way that the futures and spot price markets might portray to novice onlookers. We have documented how gold price discovery and silver price discovery markets are driven by outsized paper derivative contracts.
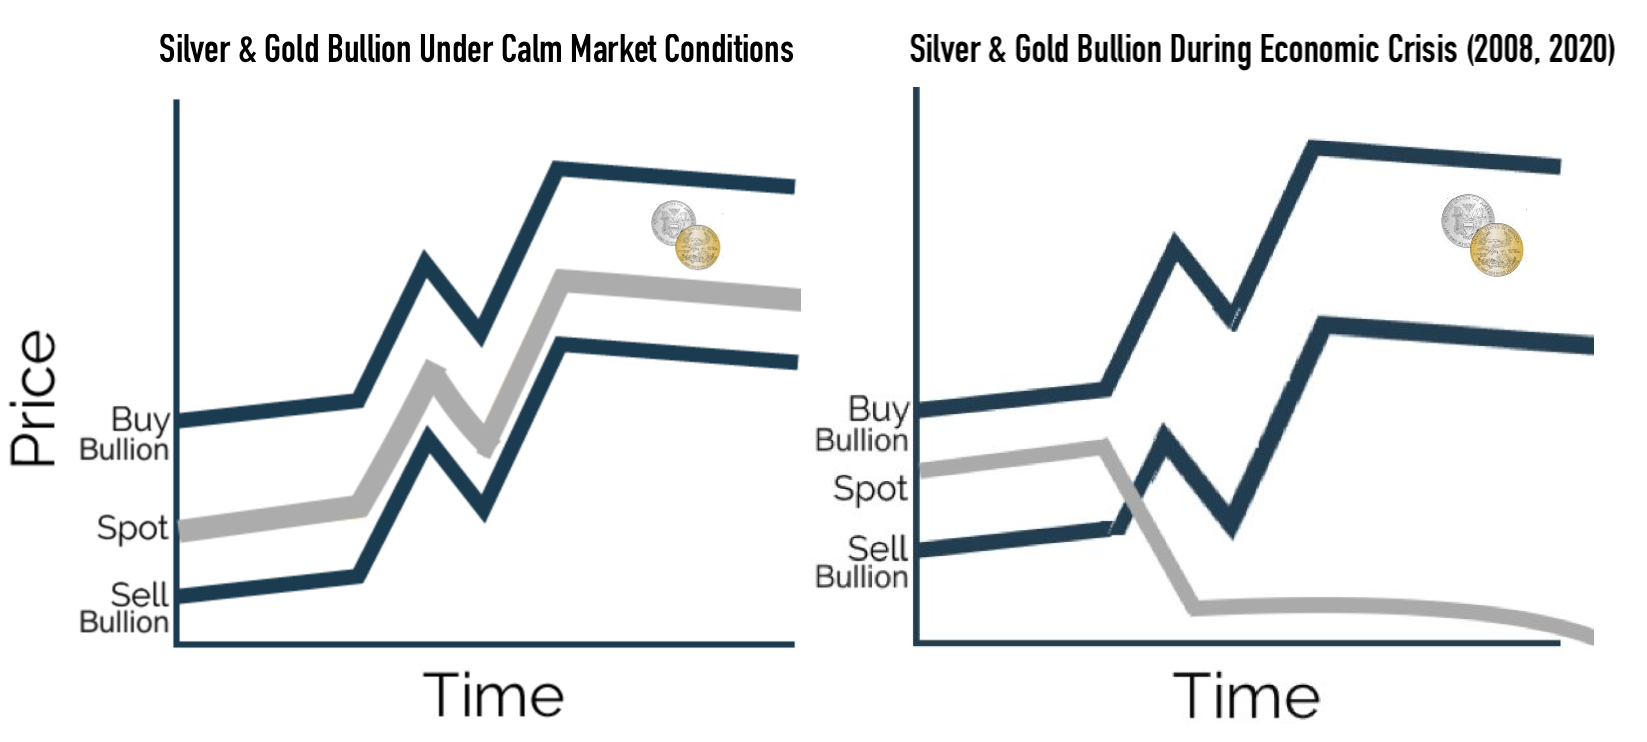
Knowing this helps one better grasp how during the 21st Century acute financial crisis and panics bullion product prices rise while spot prices often crash as leveraged derivative traders are forced to sell their long bets to meet other leverage margin calls in other financial market bets.
Gold Silver Ratio
The price of gold divided by the price of silver is a measurement that has over 5,000 years of recorded human history and price data. This Gold-Silver Ratio measurement is often used by bullion buyers and investors to gauge ongoing trends and judge historical valuations when allocating capital into the precious metals sector [ i.e. What is the Gold Silver Ratio? ].
It is only in the last century of central bank dominance and post-industrial revolutionary mining that we have seen the Gold Silver Ratio (GSR) expand beyond its historic median ranging in the teens for millennia in Silver Price History.
Before modern precious metal mining and refining of our post-industrial era, the beginning gold-silver ratio written in the Code of Hurrmambi began over five thousand two hundred years ago in the low single digits in Ancient Egypt (GSR 2.5).
Many silver and gold bullion bulls expect we will again see the Gold Silver Ratio fall in the 2020s back toward and even beyond its low of 33 in the year 2011 (see these historic silver price highs and a billionaire’s early 2020 reasonings for why silver bullion is a great long term bet).
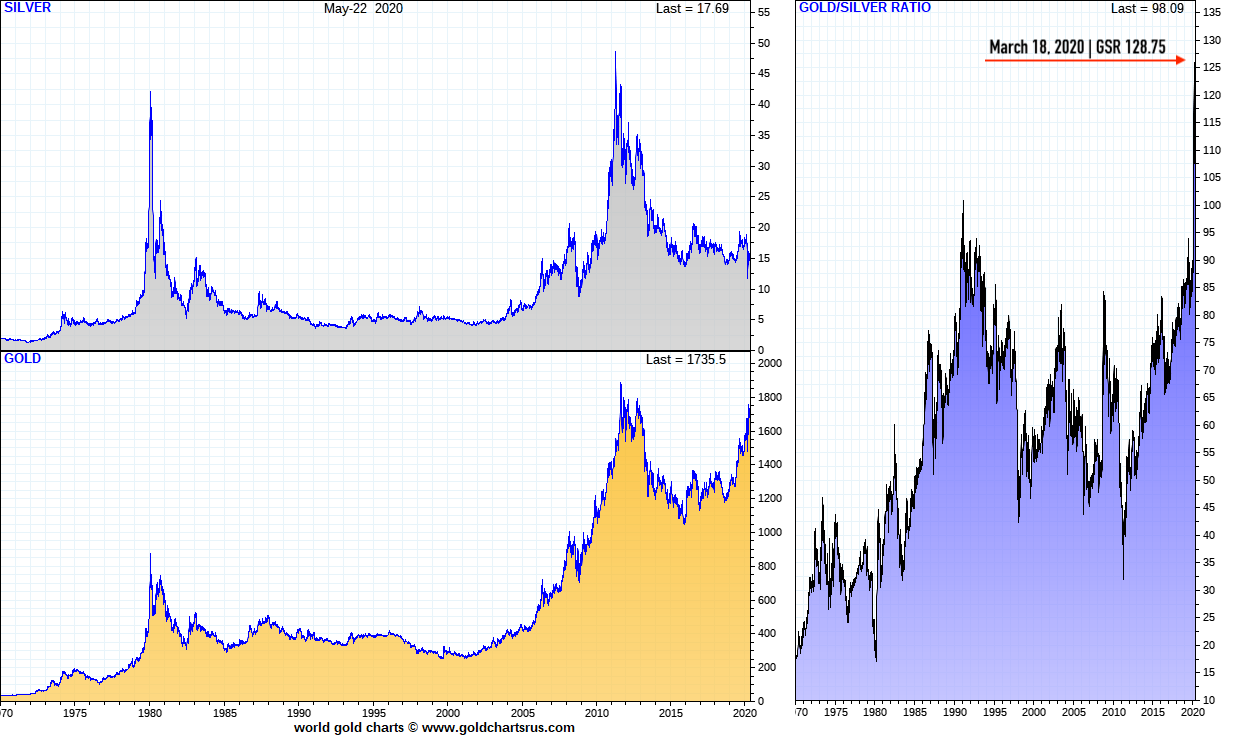
The following chart illustrates the full fiat $USD prices for gold, silver, and the gold-silver ratio throughout this full fiat currency era.
In the shorter term chart below, we focus on the gold, silver, and gold-silver ratio action since the viral crisis hit financial markets in 2020. Note the relatively fast rebound from the selloff.
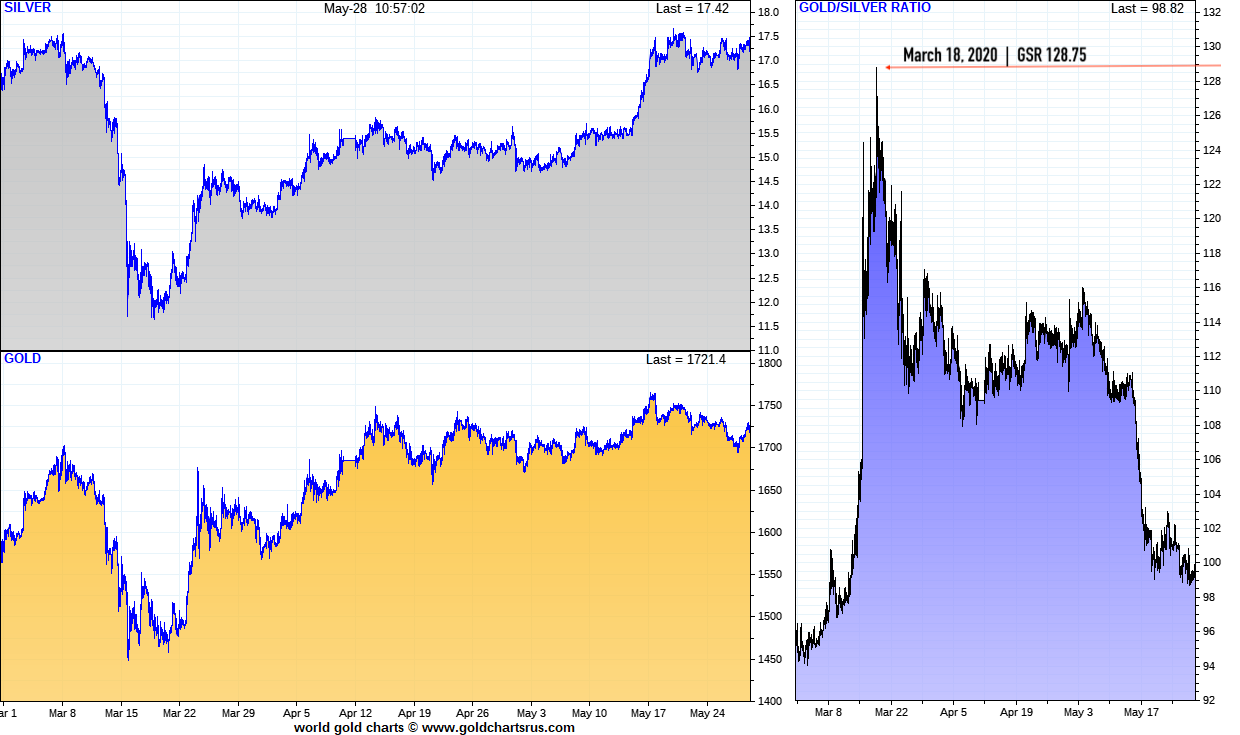
During perhaps the peak of this viral COVID economic freezing, the Gold Silver Ratio blew out to an intraday high of 128.75 on Wednesday, March 18, 2020 (the US stock market bottomed only a few days later).
On that very same day, we here at SD Bullion released the following video illustrating the then exacerbated and still to this day, ongoing bullion versus derivative futures and spot price disconnection.
Gold Silver Ratio hits 128.75 intraday vs Bullion Ratios Same Day
Highest Gold Silver Ratio 132.4 | Last Great Depression 1933
Recently with this viral financial crash, many analysts and commentators around the world erroneously claimed this GSR spike in March 2020 was the highest on record. It was not.
For the year 1933, during the last Great Depression, we display the all-time high spot gold/silver ratio using a pink coloring. A record Gold Silver Ratio level of 132.4 was reached during 1933 during a four-month stretch spanning June through September 1933 with gold priced at $33.11 oz and silver an all-time low in silver price history bottoming out at 25¢ per troy ounce.
The highest gold-silver ratio in history happened during the peak of the last Great Depression (1933) as silver bottomed at 25¢ oz while the President FDR confiscated gold bullion coins and devalued the then US dollar some -69.3% to gold. The new arbitrarily price for gold required bidding up but a still too deflationary price of $35 oz extending the depression until WW2.

Gold Silver Nationalization with US Dollar Devaluations 1933-34
Every now and again, the term Gold Confiscation gets lobbed onto a story either in the alternative or mainstream financial media, and mostly the reason is clickbait, not for actual research nor understanding about its history.
It was just over one full human lifetime ago, therefore it is almost fully forgotten in detail how the US confiscated gold under the guise of combatting the then deflationary depression. Also under threat of imprisonment and a $10,000 USD fine (about $800k in today’s fiat Federal Reserve notes) about 1/4th of the US citizenry complied with the 1933 US Executive Order 6102.
Even your average factoid mind-cluttered contestants on Jeopardy are clueless about this economic history. Perhaps the state never wanted this moment in US citizen’s history to be relearned.
Can you beat Eric?pic.twitter.com/W4FlHSYsbM
— James Henry Anderson (@jameshenryand) March 12, 2020
The year 1933 issued US Presidential edict mandated all US citizens turn in virtually all private gold bullion coins and bars. No more than $100 USD in gold could be held per US citizen from the year 1934-1974 (equated to no more than 2.85 oz gold per saver).
To again have the choice to save in gold bullion was only “relegalized” once the price of gold in fiat Federal Reserve notes had already run from $35 to nearly $200 oz by the start of 1975.
Only months prior with the gold price in 1974, the US Treasury was conspiring with London gold powers over how to inject price volatility to deter US citizens in mass from running out of fiat $USD into bullion (the US Treasury choose overleveraged gold futures trading via the COMEX in 1975 as their fiat $USD demand defense).
Any and all price containment efforts were fully overrun by January 1980 as the US could have, based on the then high gold price, gone back on a gold standard into the year 1981. Apparently we chose to outspend the Soviet Union and fiat financialize our domestic economy instead.
Let us digress, back to the last Great Depression.
US silver bullion holders under the year 1934 Executive Order 6814, were required to turn in their silver for 50¢ oz within 90 days of time. According to records about 109 million ounces of silver got turned in as a result. That is less of a physical silver hoard than either Warren Buffett’s Berkshire stacked in the late 1990s, nor what JP Morgan and its clients alone have sitting in their COMEX warehouse as of this year 2020.
The last Great Depression of the USA set forth an era where even private contracts between US citizens could be violated by the state’s fiat dictation that it has a plenary power to regulate money. Gold clauses be damned, “here’s your devaluing state-sanctioned paper currency for the services and goods we contracted over.”
Nevermind that the US Constitution explicitly says, no state (US entity) shall… coin money, emit bills of credit, make anything but gold and silver a tender in payment of debts. We have not issued circulating sound currency in real volumes since the last 1964 silver coins were issued.
Safe to say fiat animal spirits escaped the barn over five decades ago, and we are setting up to relearn many of the ugly lessons of fiat currency history to come. The US Congress just simply further allows fiat currency created at will via the private Federal Reserve system. The US Treasury and the Federal Reserve are now combined so they can buy up junk bonds, equities, and bailout connected insider corporations and cronies.
Gold Silver Ratio Bullion Shortage 2020
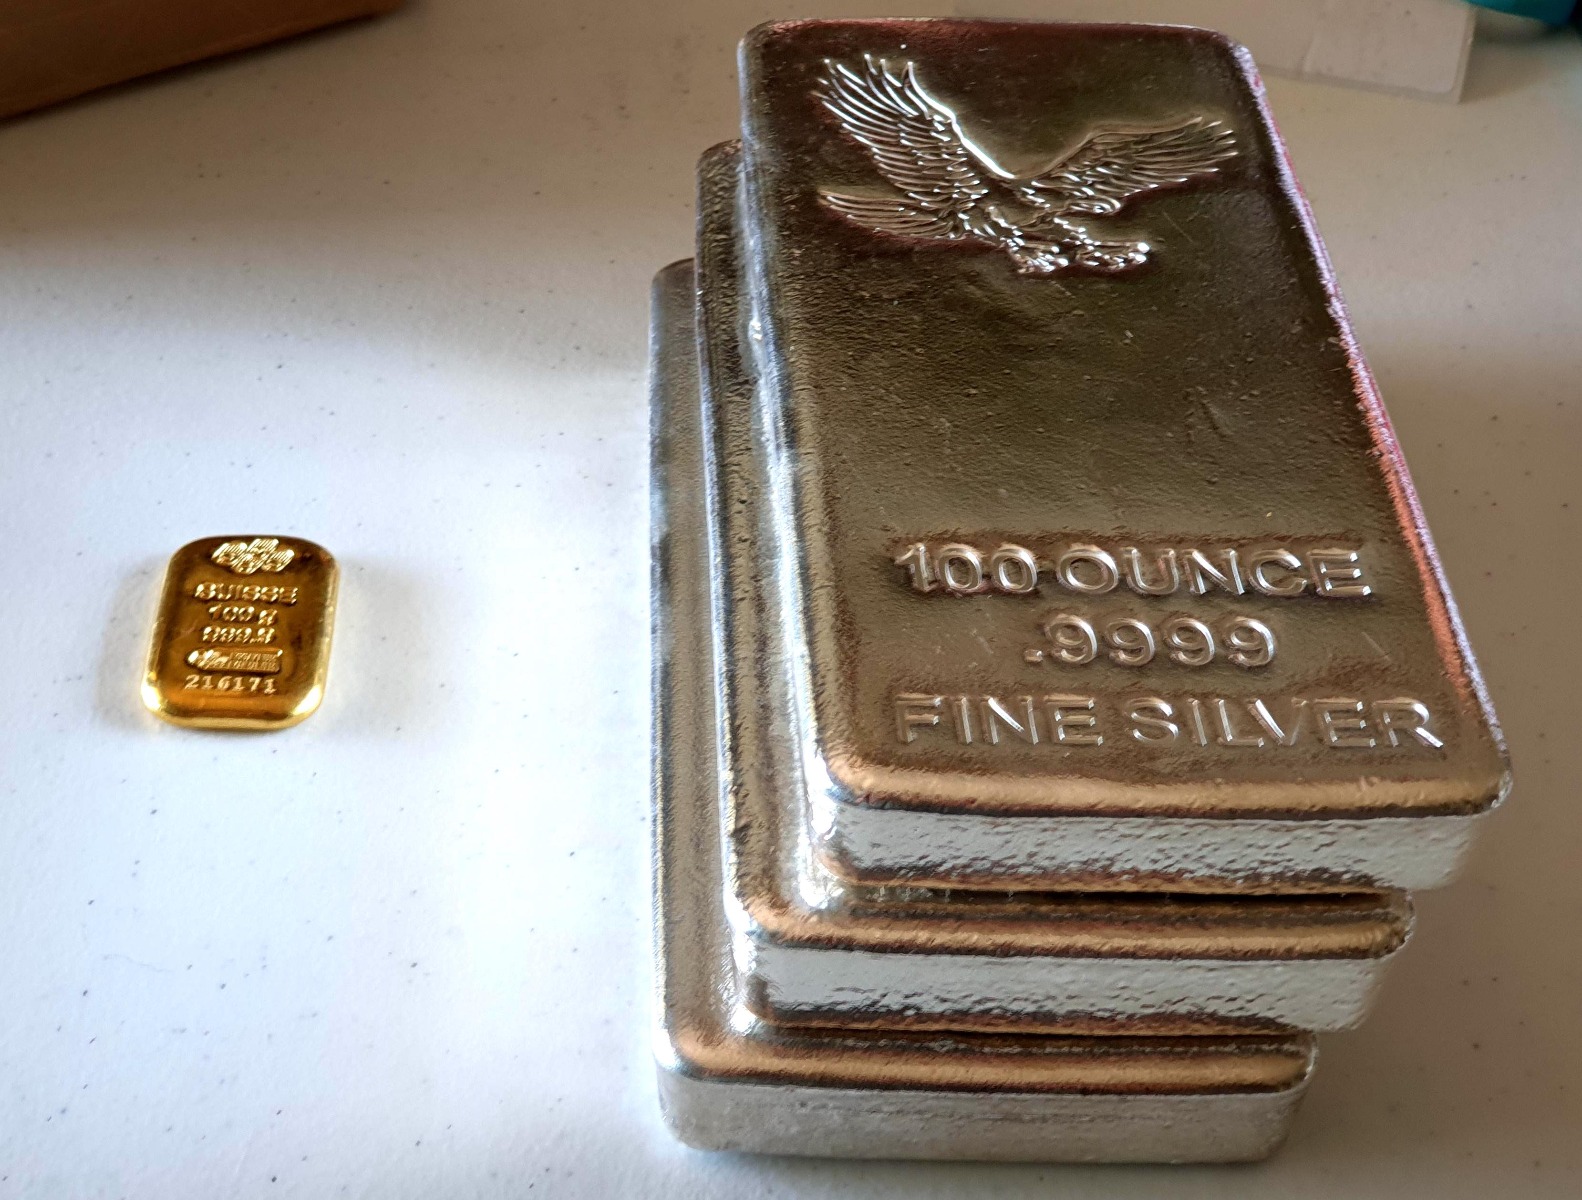
The following image depicts what $5,000 fiat Federal Reserve notes in early April 2020 reportedly got an investor in terms of gold bullion (100 grams or 3.215 oz bar) versus silver bullion (300 oz total).
That equates to a then physical bullion bar gold silver ratio of 93.3 while the derivative driven GSR in April of 2020 was typically claiming one hundred and teens day to day.
The following chart depicts the gold vs silver fiat $USD price and the gold silver ratio throughout this now nearly 50 year long full fiat currency era. A time worldwide devoid of any sound monetary standard or discipline, with now record sized currency creation ongoing.

Many bullion bulls believe that only one of these 100 oz silver bars will afford that much gold bullion later this decade, a slight surpassing of the year 2011 low near a then bottom of 33 on the gold silver ratio.
After all, the gold silver ratio has been recorded for over 5,000 years of time. And we have yet to see how it performs under a truly global fiat currency and debt crisis we believe is now underway.
Please enjoy and share this Gold Silver Ratio graphic with those you deem worthy.
|
|
|
|
|
Share our original content for free using these guidelines:
– Please link back to the original source here
– Please provide attribution to “SD Bullion”