It is indeed rare when pursuing the internet for free gold and precious metal related content, one runs into exceptional research and insight.
The following snippet, charts, and backlinks are an exception to often dull precious metal content publishing and insightless market coverage.
It was created by two former commodity fund managers who at their peak ran investment portfolio funds with over $5 billion USD in value. The two gentlemen own and run Goehring & Rozencwajg, are not only highly experienced but their commodity investing track records are deep and noteworthy.
Below is a short snippet on what they recently published about gold and precious metal values ahead.
We will also backlink multiple times directly to their website, where you can sign up for free to receive their 2018 Q2 publication. That additional research tackles what we agree is a currently severely undervalued precious metal sector, specifically on page 16 of their Q2 2018 publication.
The following is a recent blog post from their website.
September 25, 2018 - Goehring & Rozencwajg
We believe gold today is undervalued and that a huge gold bull market could lie in front of us.
As we wrote extensively first in the late 1990s and again today, we believe that gold has become radically undervalued. Although many investors believe that gold can’t be valued, we take a different view. We believe gold is like any other asset class. Asset classes (bonds, stocks, emerging markets, commodities or gold) become popular, sustain large price advances and become overvalued. At that point, they represent poor investments. Conversely, these same asset classes will often undergo long periods of investor disinterest, experience sustained and drawn-out price declines, and consequently will become undervalued. At that point, they often represent excellent investment opportunities.
We agree with consensus opinion regarding gold on a long-term basis: gold represents a poor investment. As its critics correctly point out, it pays no dividends or interest, and it is expensive to store. However, if investors can properly identify those periods when gold is severely undervalued, then gold (as an asset class), can produce superior (and indeed often spectacular) uncorrelated returns, just like it did back in 1929, 1970 and 1999.
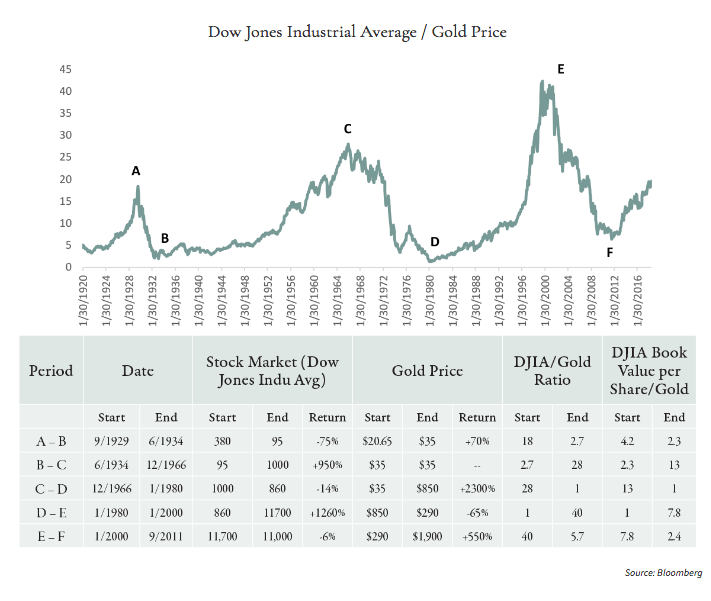
Let’s look at how gold has historically been priced relative to financial assets. The popularity of financial assets (especially the stock market) and gold tend to be inversely correlated and by measuring the divergence between stock prices and gold we can see where we stand in the investment cycle. One of our favorite ratios is the price level of the Dow Jones Industrial Average to gold’s price. As you can see from the chart below, there have been three distinct periods of extreme overvaluation of financial assets versus gold in the last 100 years: 1929, the late 1960s/early 1970s, and 1999/early 2000s.

Today, with the stock market having more than doubled since 2011 and gold prices today 35% below their 2011 peak, the Dow to gold ratio stands at 20. Although we have not reached the valuation extremes of 1970 or 1999, we are trading above the ratio of 18 achieved back in 1929, which was the first distinct period of extreme overvaluation during this 100-year span. (For more information on this and other valuation metrics such as the relationship between the size of the US Federal Reserve’s balance sheet and the dollar value of the Treasury’s gold holdings, we encourage you to read our full Q2 2018 commentary.)
We believe the next leg in the great bull market could begin to take shape in the not too distant future. It has been over 38 years since we last saw speculative fevers grip global precious metal markets. We would not be surprised if the next upward move in gold ushers in a return of extreme speculative activity, something that has been completely absent from the gold bull market that started back in 2000. As the famed market commentator Richard Russell used to repeatedly tell investors: “There is no fever like gold fever.”
To read more Goehring & Rozencwajg research, download their Q2 2018 commentary.
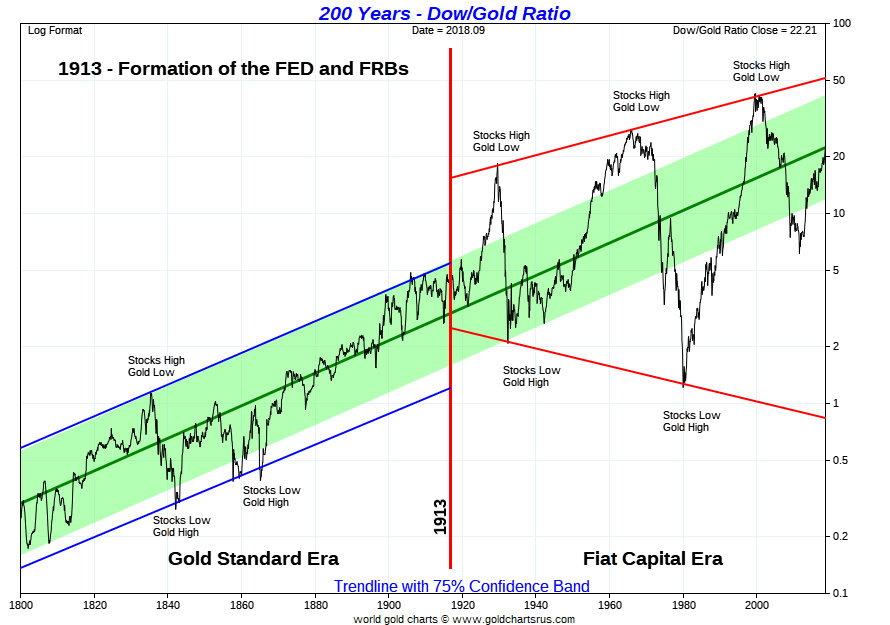
For an even longer view of the Dow Gold Ratio, we post below a 200 year version of the chart created by Nick Laird over at Gold Charts R Us (still the best player in the gold chart subscription business).
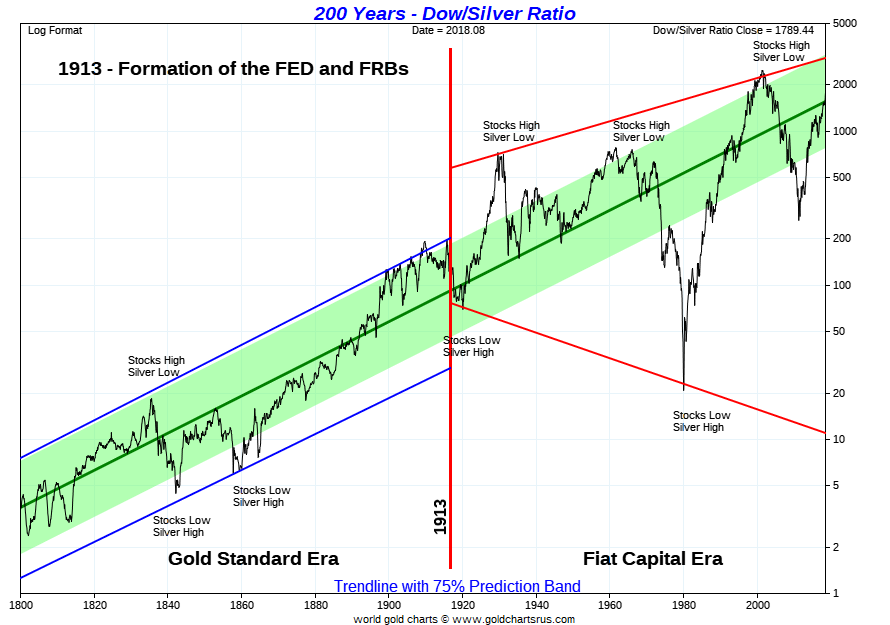
We also will post a 200 year version of the Dow Silver Ratio as well for all those silver bulls out there. Note that for both long term charts, prior to the year 1896, a surrogate index is used for the DJIA Index.
As well, also bear in mind that the DJIA is an arbitrary index of equity valuations which rotates dying and some bankrupt companies from its metric. Find out more on why and how the Dow Jones Industrial average can mislead investors.
Dow Gold Ratio 200 Years

Dow Silver Ratio 200 Years

A final outstanding gold chart among others is posted below. It takes total Global Financial Assets divided by the physical gold supply valuation (about 190,000 tonnes or 6,108,633,000 troy ounces).
It is also from the 2018 Q2 Goehring & Rozencwajg research, recently tweeted below by one of our SD Bullion research team members.
Global Financial Asset Values / Physical Gold Supply Value Chart
Another great chart here by @Go_Rozen,
albeit a less common 1, but huge metric.
1980 the monetary system got called into serious
question, next time could be worldwide.#Gold #bullion (i.e. insurance) should
well hedge other asset class
drawdowns in casehttps://t.co/NN7HsWEagu pic.twitter.com/hiB0HFs09s
— James Henry Anderson (@jameshenryand) September 27, 2018
If the investment world’s future looks anything similar to the 1980 version, prudent gold and other precious metal related investment allocations could be critical for successful wealth preservation.
***


