

Major bullion bull market news today.
Warren Buffett's Berkshire reduces Wells Fargo, JPMorgan, Goldman Sachs; adds Barrick Gold.
Warren Buffett's sale of underperforming mega commercial and investment banks is not surprising. They have been underperforming terribly of late and they all face a category 5 bankruptcy hurricane likely bearing down on all of us following this 2020 US Presidential election.
What is of note is this bet on Barrick is only over a half-billion in fiat Fed notes. And Warren's Berkshire has nearly 800 billion in total assets under management.
If supposed gold bear Buffett is going to sell the banks and go long gold, he is going to need way more exposure in his conglomerate to have any real long-lasting effects.
In sharp contrast, here are the current mining stock holdings that bullion bull Eric Sprott has acquired to date.
Warren and Berkshire have some catching up to do.
Just less than one month ago on this channel in a market update, we released entitled, "Silver's V-Shaped Spot Price Recovery."
We looked at the annual Gold Price Charts keying in on their collective U Cup-shaped breakouts, all around the world's biggest economies.
Gold in fiat Federal Reserve notes here in the USA, confirmed our recent $2,000 gold price breakout call in short order following that video.
Now it's time to do this tour around the world, looking at annual Silver Price Charts. Check out the cup shapes forming already here on the US silver price chart.
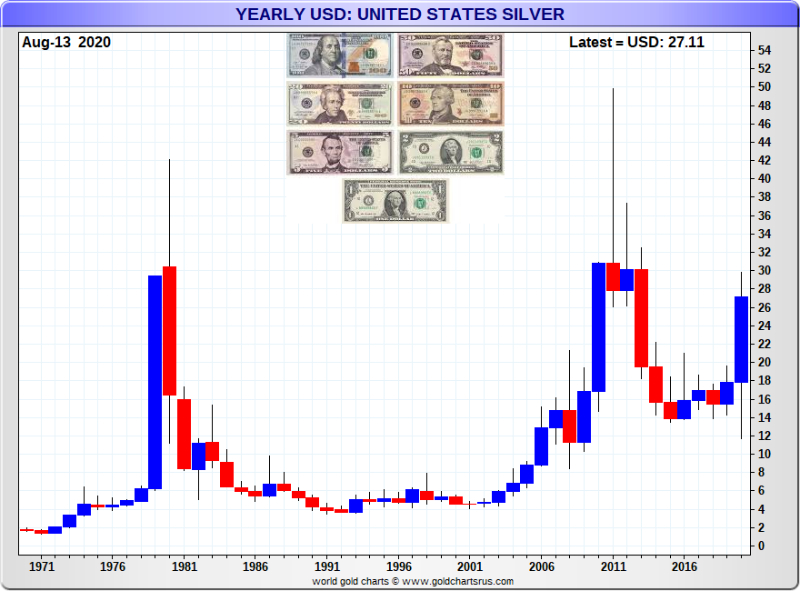
All these charts we are going to run through, they cover the full fiat currency era. Now near 5 decades of time.
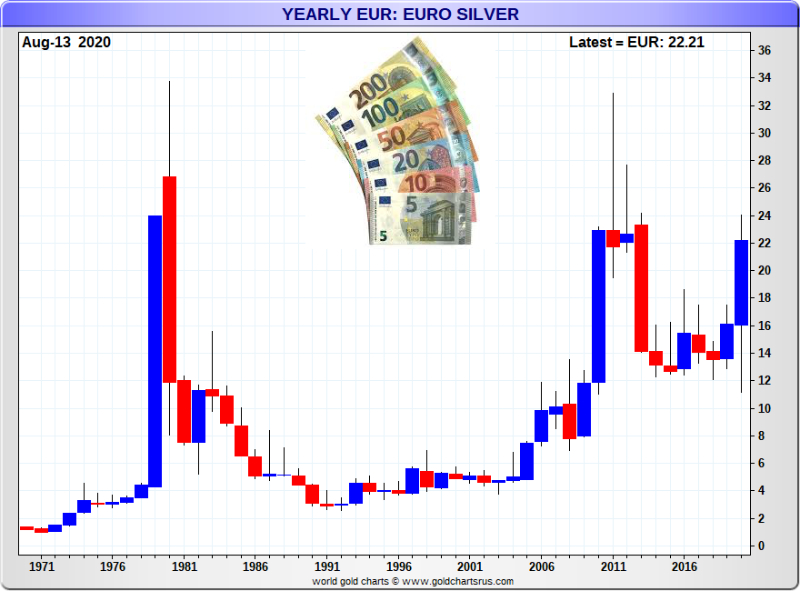
The next largest fiat reserve currency in the world the Euro. Here is it's annualized silver price chart. Note how low its historic silver price high is. We are not far away today from a 34 euro spot price silver breakout already.
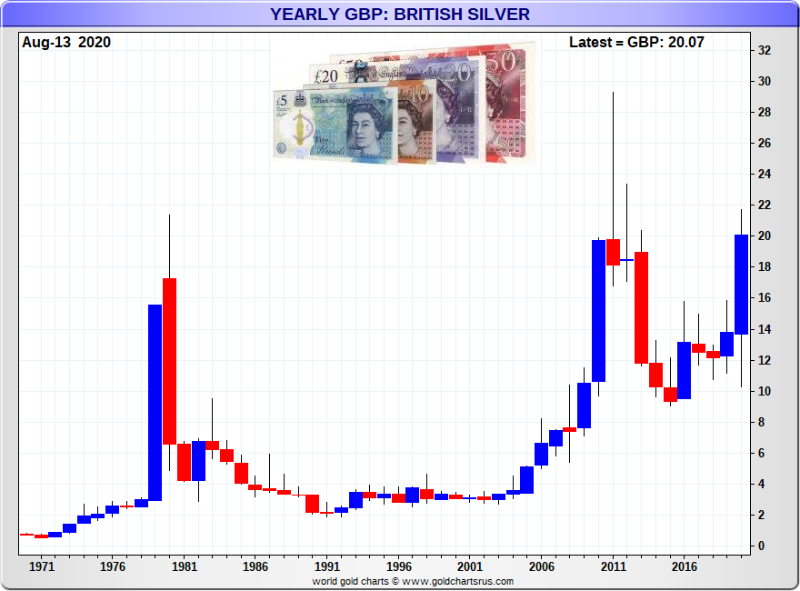
The fiat British pound, again, a similar story. An all-time high for silver in pounds is not as far away, another U cup shape forming.
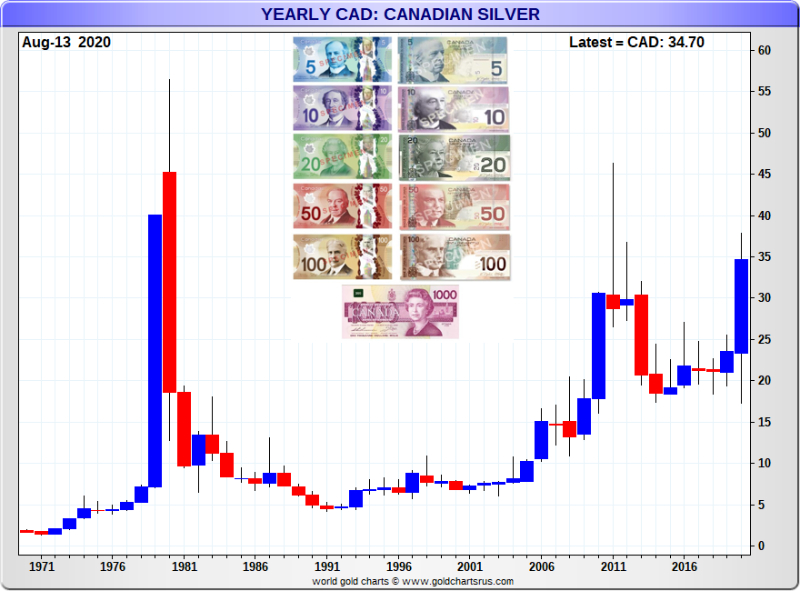
Our Canadian friends to the north, 40 spot silver not far from now.
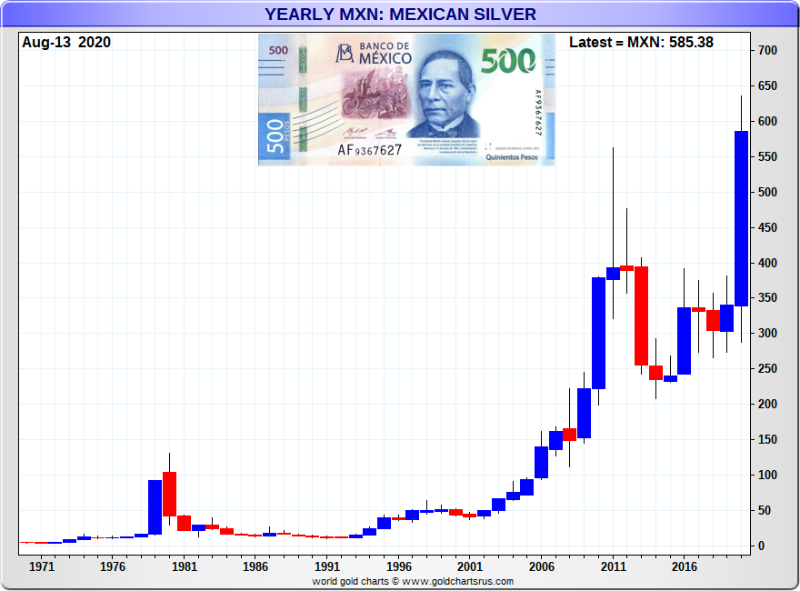
Mexican neighbors to the south, breakout. Good thing Mexico produces perhaps the newest line silver every year, just shy of 200 million ounces on an annual basis.
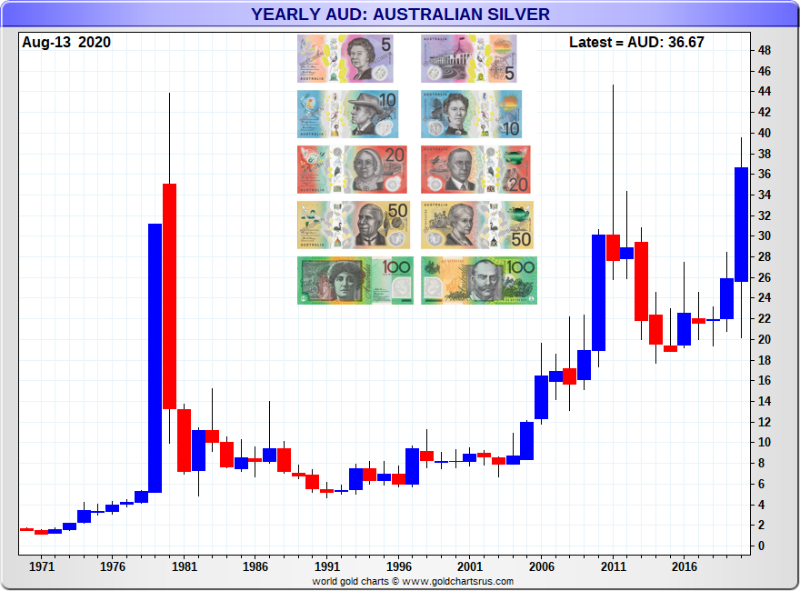
Our Aussie friends on the other side of this world. They are on the cusp of a massive silver price breakout.
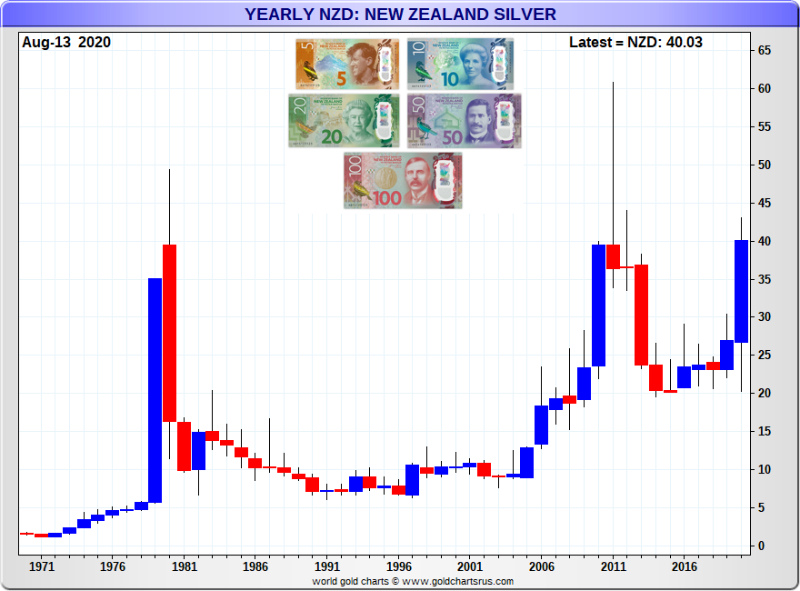
Similar story for the gorgeous country of New Zealand.
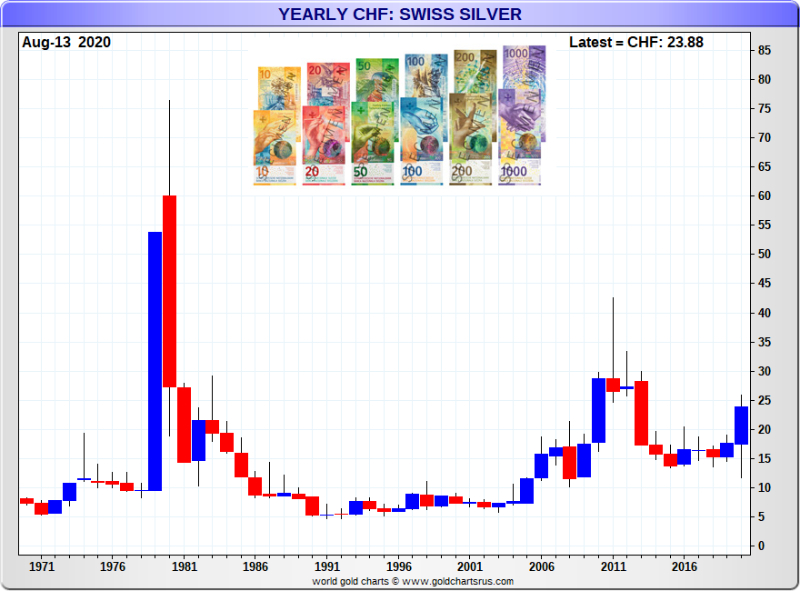
The Swiss gold stackers of the European continent, they are bound to resist their old 1980 nominal silver spot price high later this decade most likely.
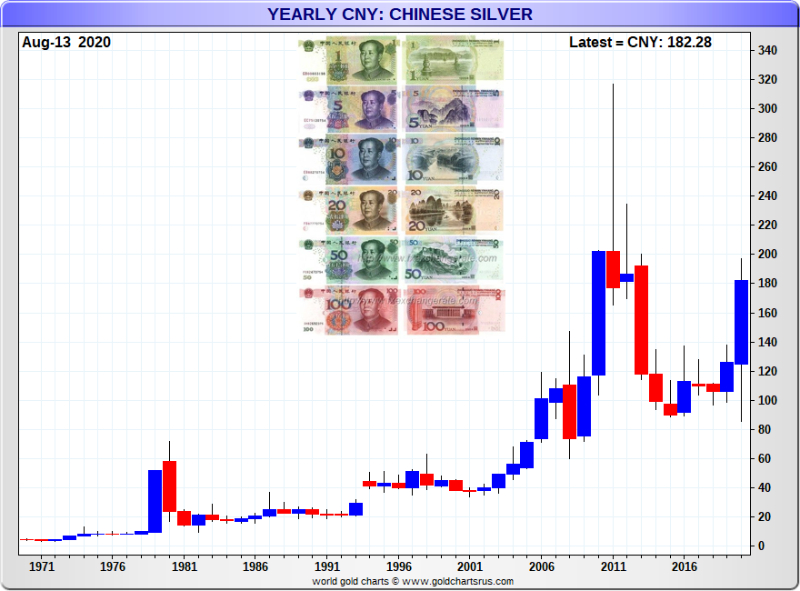
The silver price in fiat Chinese yuan is forming a U cup shape.
Although note that in China there is much like the European Union, large value-added taxes added to silver bullion imports. To the tune of +17% for Chinese silver bullion bulls. Mainly over 100 million ounces of physical silver get imported into China every year, mainly for industrial production purposes, think like silver dependent electronics, cars, cell phones, and solar panel productions.
The following silver bullion import gorilla India has been basically missing this year 2020 due the viral shutdown of their wedding season. At times during the 2010s, this nation alone imported 250 to 200 million ounces of silver.
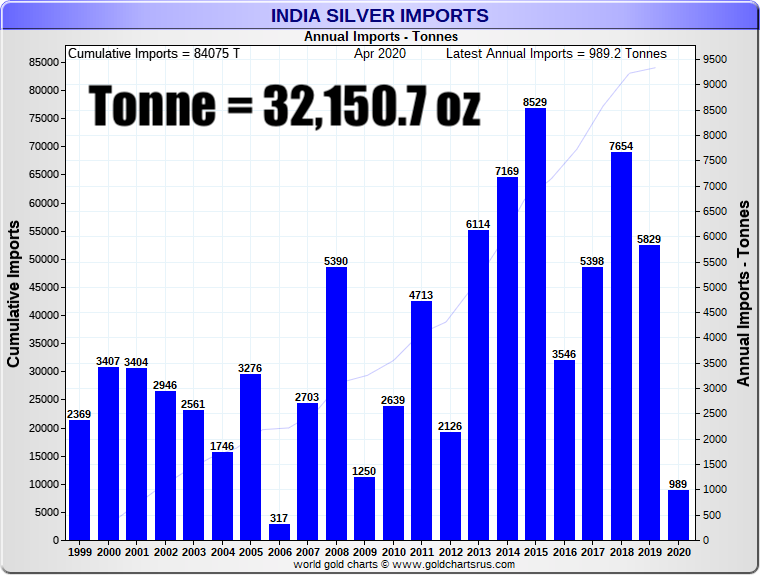
Look for this silver stacking and silver jewelry buying nation to come back hard in 2021 and 2022 with pent up physical silver demand to come.
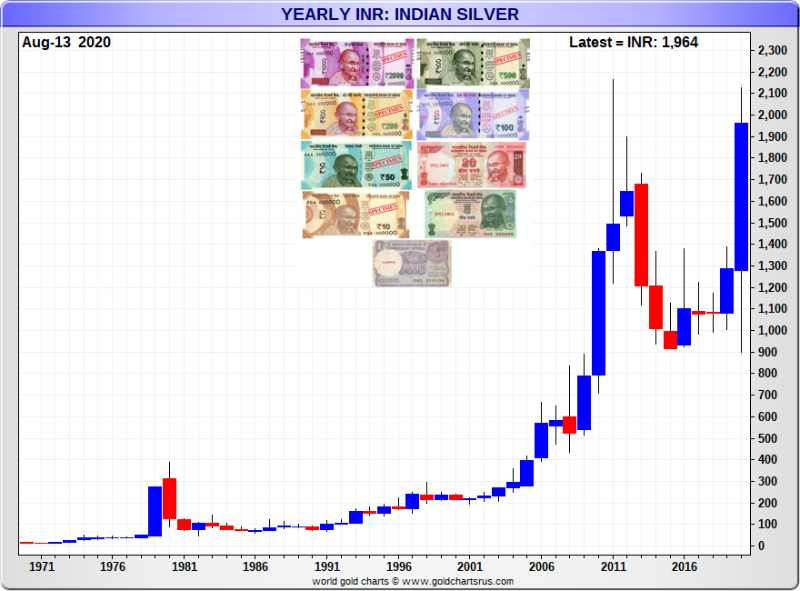
See the U cup shape on this Indian Rupee Silver price chart on the cusp of a breakout right now.
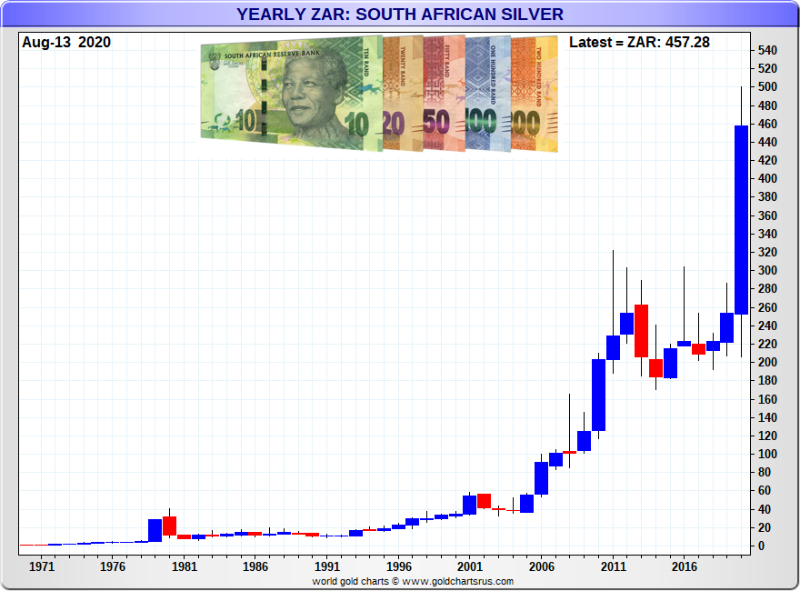
Finally to end today's tour around major global silver price charts. Have a gander at South Africa's silver price chart. I contend this is a similar look that all the previous annual silver price charts will have once similar silver price runaway breakouts occur later this decade.
That is all for this week's update.
Stay tuned, the platinum fundamental investment video is coming out soon.
Until then, take great care of yourselves and those you love.


