Silver can hedge against inflation, but a 2024 ScienceDirect study found that gold responded more strongly during high-inflation periods.
For investors seeking to preserve purchasing power, this guide compares silver with gold and examines how historical performance, industrial demand, and ownership costs affect silver’s inflation protection.
Key Takeaways:
-
Silver can hedge against inflation, but gold showed stronger responses during high-inflation periods, according to a 2024 study covering gold and silver from 1975–2023.
-
Historical silver prices demonstrate substantial risk: silver fell approximately 58% in 2008, from $20.92 in March to $8.88 in October.
-
Silver investors should compare gains with the Consumer Price Index: a hypothetical 20% price increase with 10% inflation produces a 9.1% real gain, before ownership costs.
-
Industrial applications consumed 657.4 million ounces of silver in 2025, approximately 58% of total demand, according to the World Silver Survey 2026.
-
Silver can contribute to portfolio diversification: Oxford Economics identified a 4.9% silver allocation in a simulated medium-risk portfolio. This was a model-specific finding, not a universal investing recommendation.
Comparison Chart
|
Investor consideration |
Silver |
Gold |
|---|---|---|
|
Inflation protection |
Can provide protection, but results depend on economic conditions and holding period |
Showed stronger, more sustained responses during high-inflation periods in the 2024 Science Direct study |
|
Main price drivers |
Industrial demand, investment flows, interest rates, and the U.S. dollar |
Investment and central-bank demand, interest rates, and the U.S. dollar |
|
Price volatility |
Generally greater; industrial exposure adds sensitivity to economic cycles |
Generally lower than silver, although substantial declines remain possible |
|
Economic downturns |
Weaker manufacturing demand can offset demand for wealth protection |
Less dependent on industrial activity, but can still fall during market selloffs |
|
Cost per ounce |
Lower than the gold price per ounce, making smaller bullion purchases more accessible. |
Higher, concentrating more value in less metal |
|
Physical storage |
Requires more space and weight for an equivalent investment value |
More compact for storing larger investment values |
|
Income and ownership costs |
Physical bullion pays no income; premiums, resale spreads, and storage affect returns |
Physical bullion pays no income; premiums, resale spreads, and storage affect returns |
|
Potential portfolio role |
Precious-metals diversification with greater exposure to industrial growth |
Precious-metals diversification with less industrial exposure |
Introduction to Inflation and Silver
Inflation erodes purchasing power, meaning the same amount of money buys fewer goods and services. The U.S. Bureau of Labor Statistics measures consumer price inflation through the Consumer Price Index (CPI), which tracks changes in prices paid by urban consumers. For silver to act as an effective hedge over a particular holding period, its price gains must offset inflation and ownership costs.
Silver’s inflation protection changes between economic regimes, meaning periods with different inflation conditions. A 2024 study using monthly data from January 1975 to October 2023 found that gold responded more strongly during high-inflation periods, while silver offered complementary protection during low-inflation periods. The findings support evaluating silver alongside gold rather than assuming either metal responds identically across all inflationary periods.
For investors comparing silver with physical gold, the central question is how each metal performs after inflation, not simply how much prices rise in nominal terms. Research examining U.S. and U.K. data from 1791 to 2010 found that silver’s inflation-hedging ability varied by country and methodology, reinforcing the limits of treating physical metal as guaranteed protection against rising prices.
Historical Silver Prices and Performance
Silver price history shows that inflation concerns can support demand for the metal. According to research published by the Silver Institute, quantitative easing after the Great Financial Crisis raised inflation expectations and helped boost both gold and silver prices during 2009–2011. This period illustrates how investors’ expectations about future purchasing power can influence precious metal markets.
SD Bullion’s historical silver price charts illustrate how silver approached $50 per troy ounce in January 1980, but inflation alone does not explain that peak. The Hunt brothers’ accumulation of silver and associated market manipulation contributed to the extraordinary price rise and subsequent collapse. This episode illustrates why silver’s nominal price gains should not automatically be interpreted as evidence of inflation protection.
Silver prices rose sharply during the inflationary 1970s, and inflation concerns helped renew investor buying late in the decade. CPM Group research published by the Silver Institute records an increase in silver’s annual average price from $1.54 in 1971 to $4.69 in 1974. The report also identifies rising inflation as a factor behind investors becoming net buyers of silver in 1979.
Explore Gold and Silver Prices Live Charts.
Silver as a Safe Haven During Financial Crises
The 2008 financial crisis illustrates silver’s volatility: prices reached $20.92 in March before falling to $8.88 in October, a decline of approximately 58%. Silver subsequently recovered, reaching a London benchmark high of $48.70 in April 2011, before entering another prolonged downturn. Economic uncertainty can boost demand for precious metals while still allowing silver prices to fall sharply in the short term.
During the COVID-19 pandemic, investment demand helped lift silver’s annual average price by 27% in 2020 to $20.55 per ounce. Silver’s annual average rose further to $25.14 in 2021, approximately 22% above 2020. These gains do demonstrate silver’s potential during periods of disruption, but they don't establish a consistent relationship between silver returns and inflation.
Silver’s sharp rally in January 2026 illustrates how quickly the metal can respond to changing market conditions. In a January 28, 2026 report, The Economic Times stated that silver had gained nearly 53% since the start of the year. The article linked the rally to supply deficits and investment and industrial demand.
How Do You Calculate Silver’s Inflation-Adjusted Return?
Silver’s inflation-adjusted return measures whether an investment gained purchasing power after accounting for rising consumer prices. Investors can use the Consumer Price Index to compare inflation over the same dates as their silver investment. A positive nominal return means silver increased in dollar terms; a positive real return means the investment also outpaced inflation before accounting for ownership costs.
An inflation-adjusted silver price chart expresses historical prices in dollars with comparable purchasing power. To adjust an earlier price into a later period’s dollars, multiply the earlier silver price by the later CPI divided by the earlier CPI. SD Bullion’s silver price history provides a starting point for examining price cycles. Investors should check the inflation measure and reference year used in any adjusted price chart.
A hypothetical 20% silver price gain during a period of 10% cumulative inflation produces a real return of approximately 9.1%, before ownership costs. The calculation is (1.20 ÷ 1.10 − 1) × 100. Comparing nominal and inflation-adjusted returns provides valuable insights into whether silver increased an investor’s purchasing power.
Silver’s Inflation-Adjusted Price Performance Since 1990
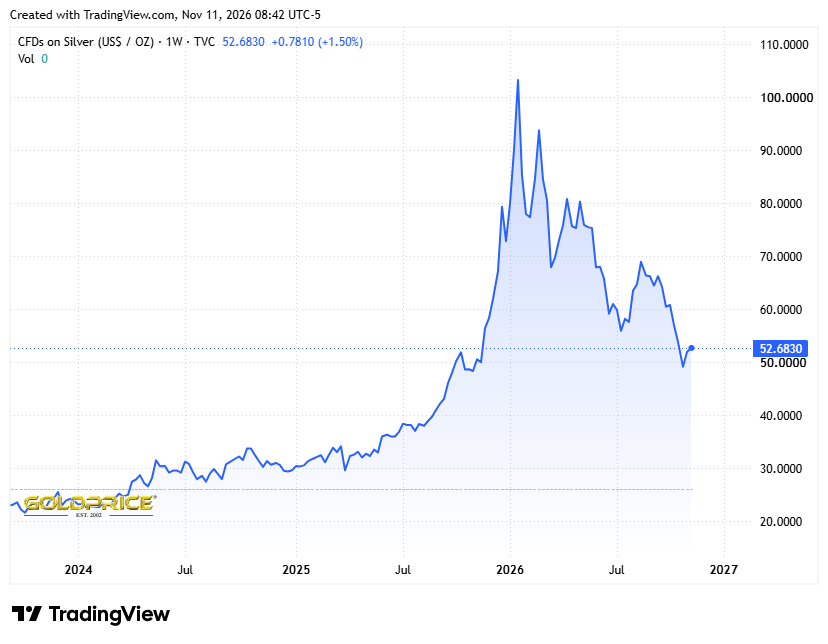
World Bank monthly price data show silver’s monthly average price rising from approximately $5.25 per troy ounce in January 1990 to $30.76 in December 2024 and $62.30 in December 2025. Silver averaged $92.10 in January 2026 before declining to $53.00 in November 2026.**
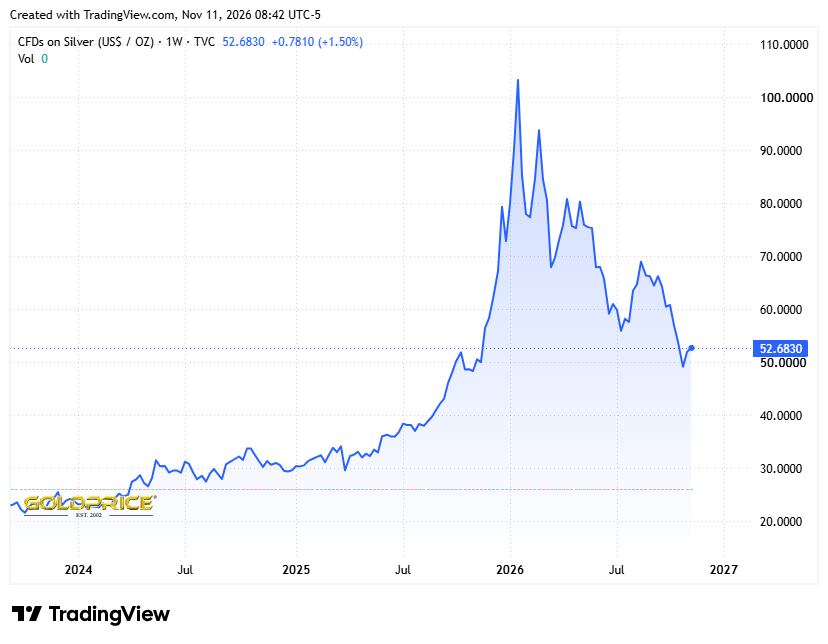
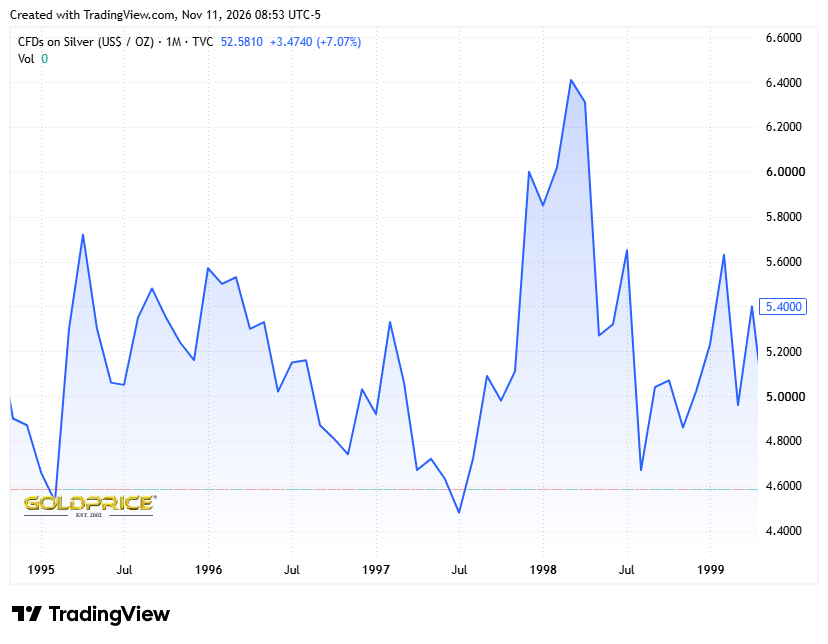
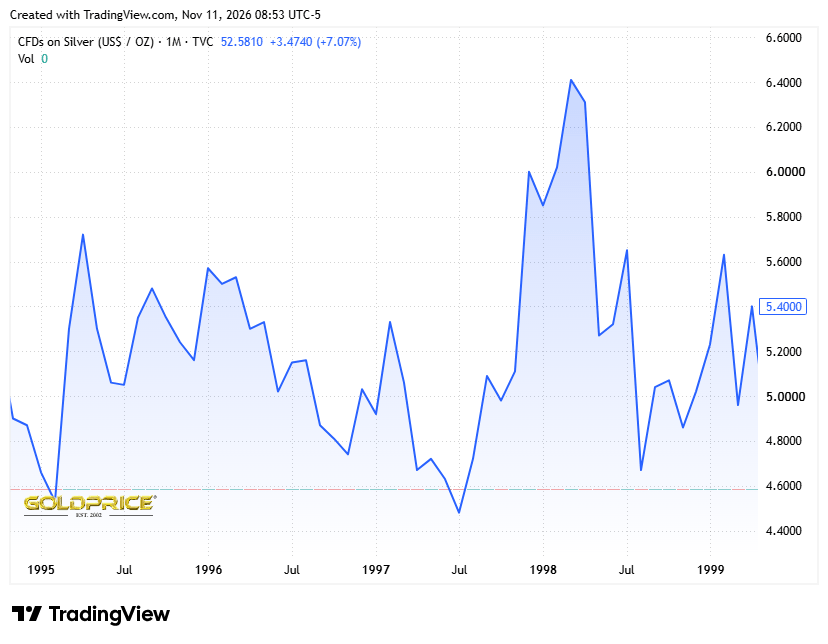
Silver struggled to protect purchasing power during parts of the 1990s. Comparisons of World Bank silver prices with BLS inflation data show losses after inflation between January 1990 and December 1992. Between January 1995 and December 1999, modest gains in silver prices also failed to keep pace with rising consumer prices.
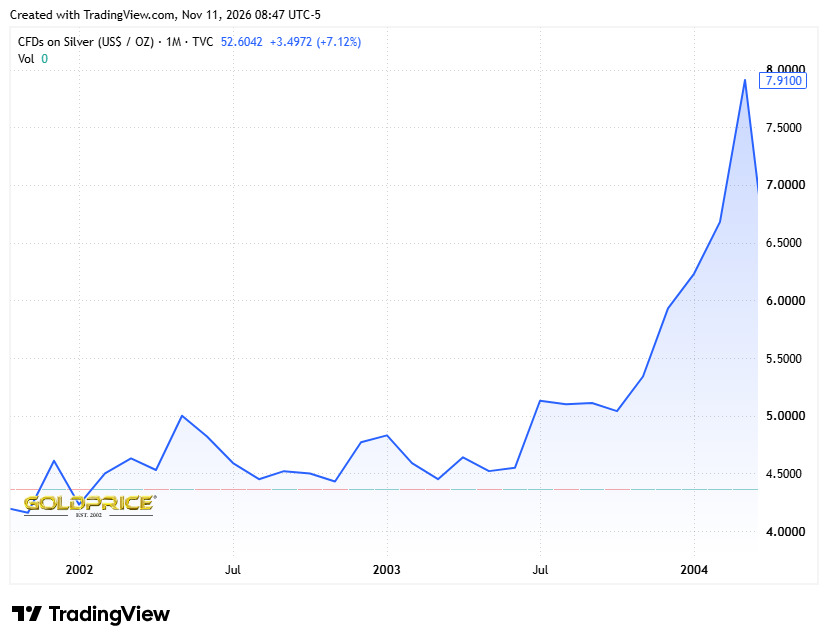
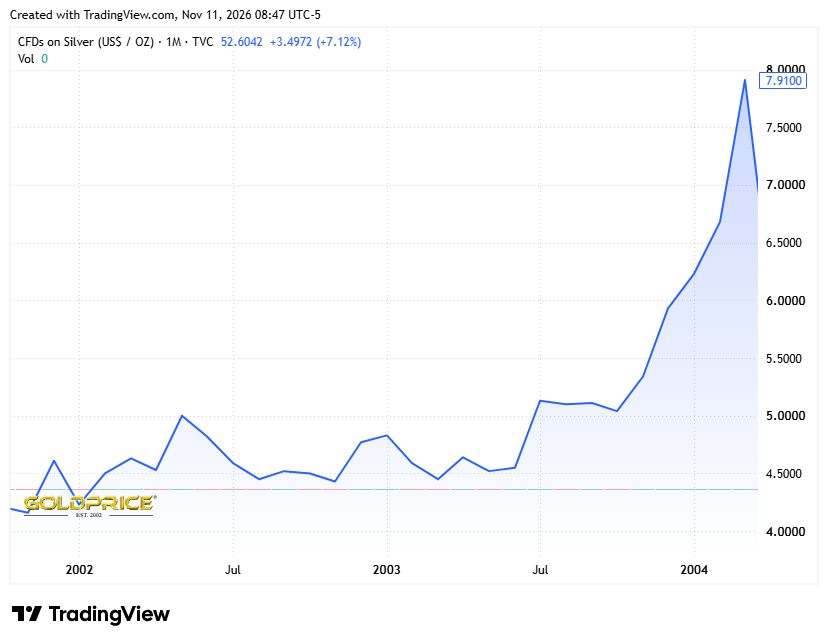
Silver’s performance improved in the early 2000s, with a clear gain in purchasing power in 2003. Its monthly average price rose from approximately $4.63 in December 2002 to $5.63 in December 2003, according to World Bank data. The increase exceeded consumer price inflation over the same period.
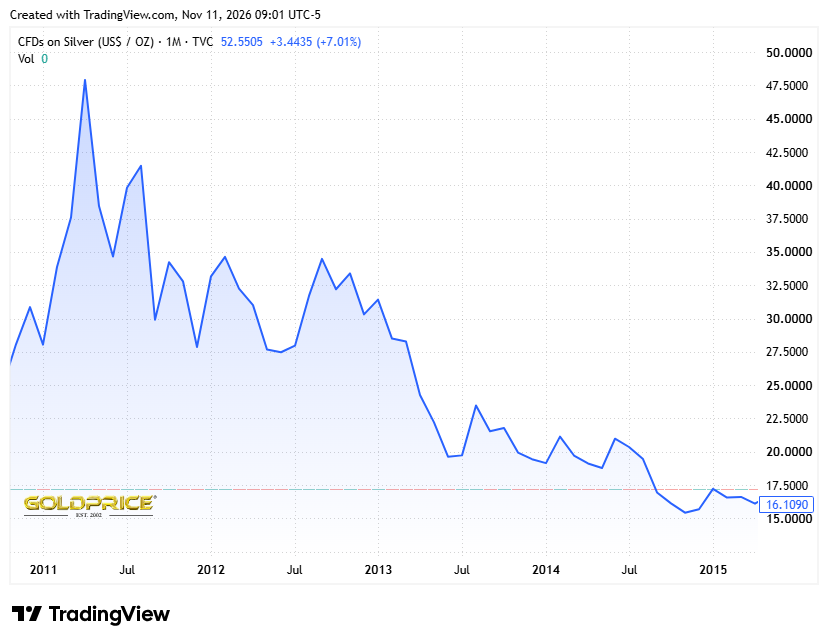
Silver’s rally into 2011 was followed by a prolonged decline that reversed substantial gains. World Bank monthly averages rose from approximately $18.06 in April 2010 to $42.70 in April 2011, before falling to $14.13 in December 2015. Comparisons with the Consumer Price Index confirm a strong inflation-adjusted gain during the rally and a substantial loss afterward.
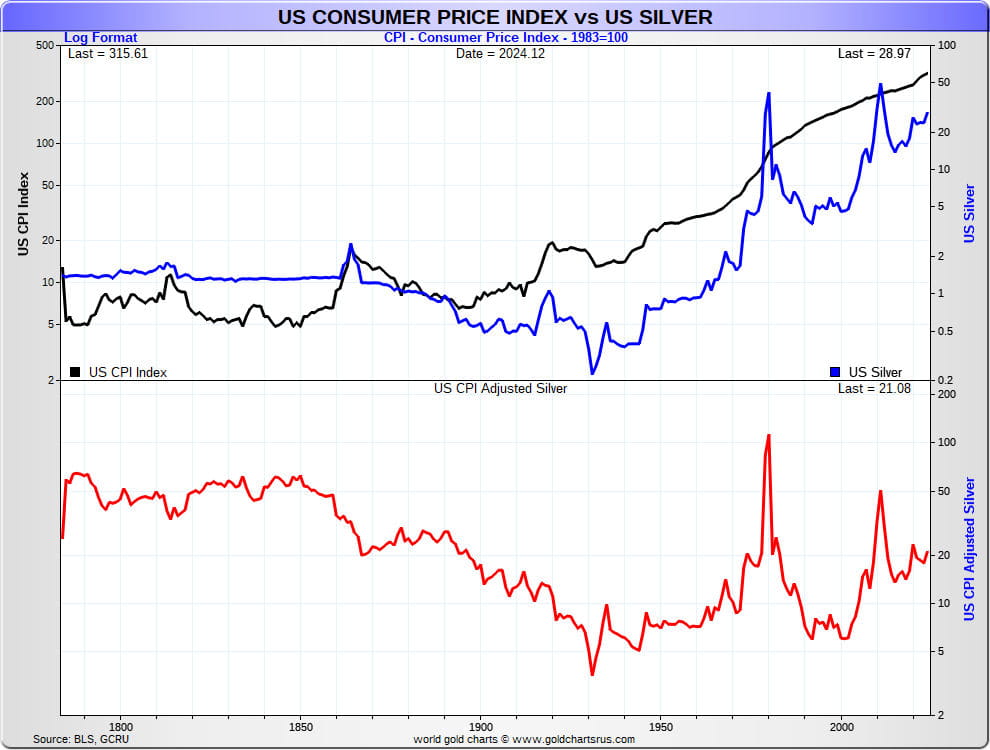
The chart below tracks the silver price versus the Consumer Price Index for over 200 years:
Silver as an Inflation Hedge
Silver can serve as a hedge against inflation and currency depreciation, helping investors diversify beyond cash. A 2024 Capitalight Research report commissioned by the Silver Institute identifies silver’s tangible nature, investment appeal, and industrial uses as reasons to include it in a diversified portfolio. Silver’s ability to preserve purchasing power depends on its price performance over the holding period, so inflation protection is a potential benefit rather than a guaranteed outcome.
A 2024 study published in the International Review of Economics & Finance, examining gold and silver returns from 1975 to 2023, found that gold responded more strongly during periods of high inflation, while silver was more sensitive to industrial activity and economic growth. So, silver can provide inflation protection, but historical data does not support calling it the best or most consistent hedge against rising prices.
Silver’s greater price volatility than gold creates opportunities for larger gains while exposing investors to sharper losses. Oxford Economics’ research on silver in investment portfolios documents higher volatility alongside potential diversification benefits. Silver’s industrial demand can benefit from manufacturing growth and weaken during downturns. Greater volatility alone does not make silver better suited to either long-term holding or short-term trading.
How Do Economic Uncertainty and Monetary Policy Affect Silver?
Investors sought refuge in silver during the uncertainty of the COVID-19 pandemic, although silver does not share gold’s official reserve status. The Silver Institute’s World Silver Survey 2021 reports that silver-backed exchange-traded products added 331 million ounces in 2020 amid pandemic fears and monetary stimulus. The IMF classifies monetary gold as a reserve asset but excludes silver bullion, so central-bank gold demand should not be presented as silver demand.
The end of gold convertibility changed the monetary framework in which gold and silver trade. Under the Bretton Woods System, the dollar was convertible into gold for foreign monetary authorities at $35 per ounce. President Nixon suspended conversion in August 1971. Today, monetary policy influences silver partly through real interest rates: lower inflation-adjusted yields reduce the opportunity cost of holding silver, which pays no interest, unlike an interest-bearing savings account.
Investing in Silver
Investors can gain exposure to silver through physical bullion, silver-backed exchange-traded products, or mining stocks. Each provides a different balance of ownership, convenience, costs, and risk. Silver may contribute to portfolio diversification, but its price volatility means it cannot guarantee 100% protection against inflation or economic uncertainty.
Silver’s dual role as an industrial metal and investment asset can support portfolio diversification through different sources of demand. A 2022 Oxford Economics study commissioned by the Silver Institute found relatively low historical correlations between silver and assets other than gold. Its analysis of 1999–2022 data identified a 4.9 % silver allocation in a simulated efficient medium-risk portfolio, illustrating potential diversification benefits rather than a universal allocation recommendation.
|
Investment option |
What investors own |
Main considerations |
|---|---|---|
|
Physical silver coins, rounds, and bars |
Tangible bullion |
Dealer premiums, resale spreads, storage, and insurance |
|
Physically backed silver ETFs and trusts |
Shares in a vehicle holding silver |
Brokerage access, ongoing fees, and custody arrangements |
|
Silver mining stocks and mining ETFs |
Ownership interests in mining businesses |
Company performance, mining risks, and broader stock-market movements |
Physical Silver vs. Stocks and Bonds
Stocks and bonds can provide income that helps offset inflation, while physical silver pays no interest or dividends. Dividend-paying stocks distribute income, and many bonds pay interest, but companies can fail, and bond issuers can default, as explained in the SEC’s guide to saving and investing.
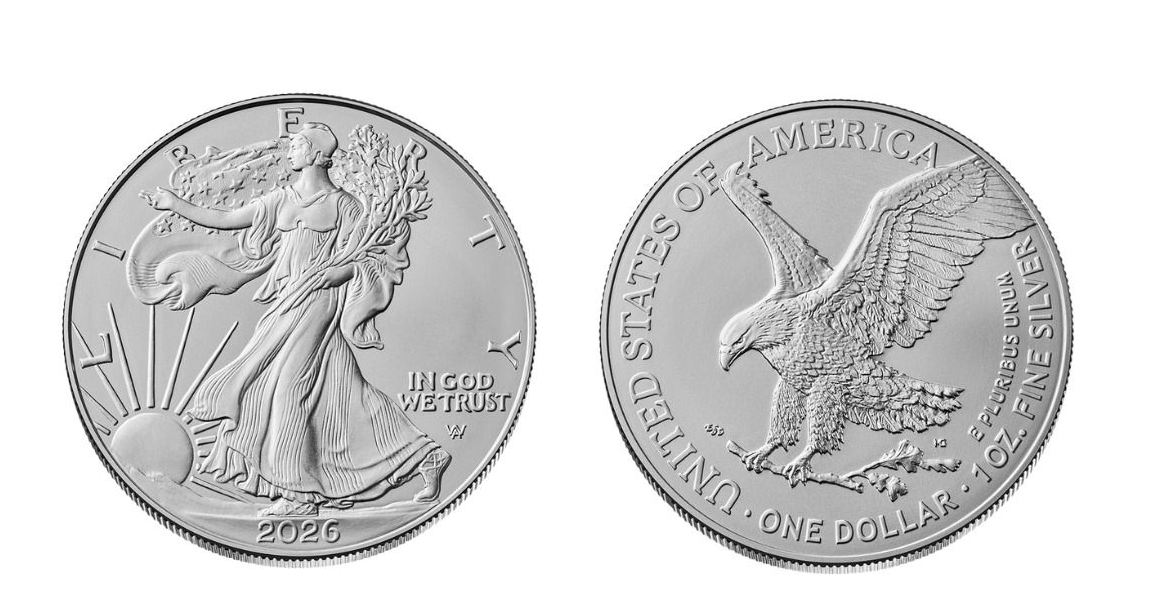
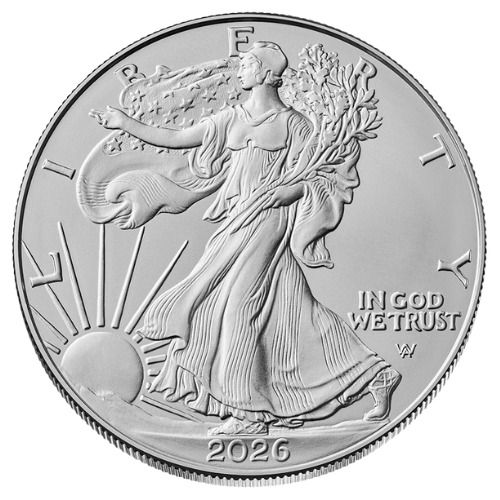
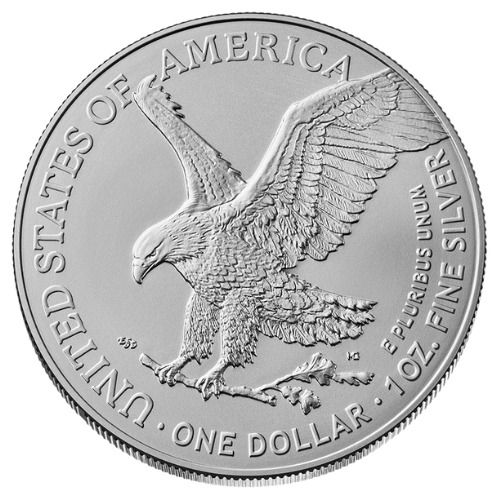
Directly held physical silver has no issuer default risk. Its investment returns depend on price appreciation after purchase and ownership costs. Products such as 1oz American Silver Eagle coins, silver rounds, and silver bullion bars and other silver coins as a valuable investment option allow investors to hold silver without relying on a brokerage account or financial intermediary.
Buying Silver Through an Online Brokerage
Investors can use digital platforms to buy and sell silver-backed investment products without arranging physical storage themselves. Investors can use online brokerage platforms to buy silver-backed investment products without arranging personal bullion storage.
A Trust seeks to track silver bullion prices and trades through brokerage accounts. Investors can buy and sell shares during market hours, although expenses and trading costs affect returns. Ownership of shares differs from directly owning coins or bars.
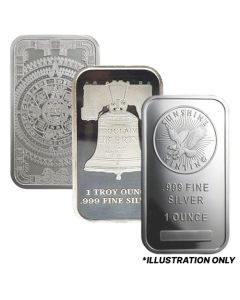
SD Bullion helps silver investors compare purchase options and plan for resale. Its silver bars selection displays available weights and purchase prices, including larger-format 100 oz silver bars for long-term wealth storage and versatile 10 oz silver bars for portfolio diversification, while our sell-to-us page explains the buyback process. Compare dealer premiums, ownership costs, and potential resale proceeds before purchasing physical silver.
Economic Uncertainty and Fiat Currency
Physical silver is a tangible asset that central banks cannot create through monetary expansion. Its industrial and investment value offers diversification beyond fiat currency, although monetary policy can still affect its market price. Oxford Economics’ 2022 research found that silver tended to move inversely to the U.S. dollar. This supports its potential role in a diversified portfolio, although protection against currency depreciation is not guaranteed.
A weaker U.S. dollar can make silver cheaper for international buyers and support demand. Because silver is commonly priced in dollars, buyers using other currencies pay less when the dollar weakens, provided silver’s dollar price remains unchanged. Oxford Economics’ research documents silver’s tendency to move inversely to the dollar. Domestic inflation reduces purchasing power, but it does not automatically weaken the dollar against other currencies.
Silver’s History as Money
Silver has served as a medium of exchange and a way to hold wealth for thousands of years. Research summarized by the European Commission describes silver bullion’s use as currency from the Bronze Age through the Middle Ages. Silver’s long monetary history supports its identity as a tangible financial asset alongside its modern industrial uses.
The Bretton Woods agreement linked participating currencies to the dollar, while foreign monetary authorities could exchange dollars for gold at $35 per ounce. President Nixon suspended dollar-to-gold conversion in August 1971, helping bring the system to an end. Removing gold convertibility changed the constraints on monetary policy, but did not establish a fixed relationship between money supply growth, price inflation, and silver returns.
The Gold Standard, Money Supply, and Inflationary Pressures
The Great Depression illustrates how monetary conditions can produce falling prices as well as inflationary pressures. According to Federal Reserve History, the Federal Reserve failed to prevent a contraction in the money supply, while defending the gold standard influenced restrictive policy decisions. The resulting deflation is a reminder that economic uncertainty does not always mean rising consumer prices.
Monetary easing and economic uncertainty can increase silver’s investment appeal. Lower real interest rates reduce the opportunity cost of holding non-yielding silver. During 2020, silver-backed investment products added 331 million ounces as pandemic fears, monetary easing, and fiscal stimulus supported demand.
Economic Growth and Silver
According to the Silver Institute’s World Silver Survey 2026, industrial applications consumed 657.4 million ounces in 2025, approximately 58% of total silver demand. Silver offers a tangible investment with exposure to economic growth through its use in electronics, electric vehicles, solar panels, and power grids.
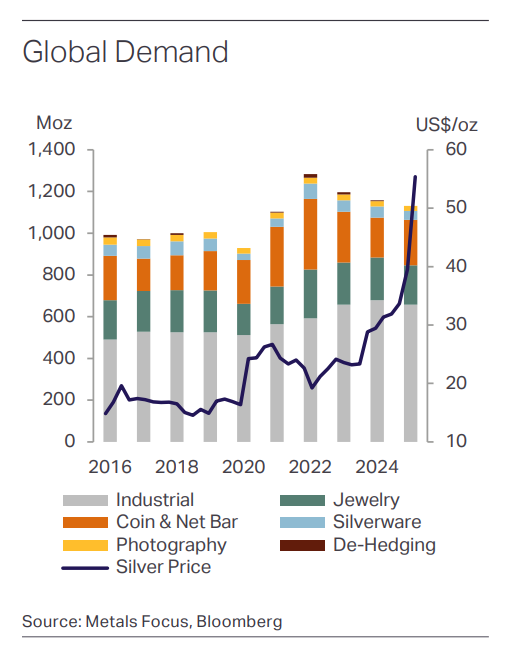
The substantial industrial use gives physical silver an investment rationale beyond wealth preservation, although demand fluctuations and price volatility still affect returns. Investors who want direct exposure to bullion can also consider compact 1 oz silver bars for flexible investing.
Electric vehicle production can increase industrial silver demand because EVs use silver in electrical contacts, power electronics, and battery management systems. According to Oxford Economics research commissioned by the Silver Institute, EVs contain approximately 25–50 grams of silver per vehicle. The report forecasts global automotive silver demand to grow at an average annual rate of 3.4% between 2025 and 2031, supported by vehicle electrification and expanding charging infrastructure.
Industrial silver demand
Industrial silver demand depends on manufacturing activity and technology use, rather than inflation alone. Higher production costs can encourage manufacturers to reduce silver usage or substitute other materials. Smaller-denomination silver gram bars as an accessible bullion option can appeal to investors seeking to match their holdings to evolving views on industrial demand and inflation.
Industrial demand for silver reached 657.4 million ounces in 2025, down 3% from 2024, according to the World Silver Survey 2026. Gains from AI infrastructure, vehicles, and power grids were outweighed by other declines, particularly in solar manufacturing, where producers reduced silver use per cell and substituted other materials.
What Did Analysts Forecast for Silver in 2026?
LBMA’s 2026 Precious Metals Forecast Survey reported an average analyst forecast of $79.57 per ounce for silver. Individual annual-average forecasts ranged from $44.25 to $125, showing substantial disagreement about the outlook. The LBMA survey summary provides a documented comparison of analyst expectations. These figures are forecasts, not realized annual returns or evidence that silver consistently tracks inflation.
How Can Silver Support Portfolio Diversification?
Silver can support portfolio diversification because its returns do not always move closely with stocks and bonds. A 2022 Oxford Economics study commissioned by the Silver Institute identified a 4.9% silver allocation in a simulated efficient portfolio for a medium-risk investor using historical data. The result illustrates silver’s potential portfolio role; it is a model-specific finding rather than a universal allocation recommendation.