Summary: Silver Price Surges above $35/oz Hitting 13-Year High and Central Banks Double Down on Gold
-
Silver Breaks Out Above $35: Silver bulls are riding high after a powerful breakout above the long-standing $35/oz resistance, closing the week near $36/oz—only the third time in U.S. history silver has crossed that threshold.
-
Historic Gold-Silver Ratio Collapse: The Gold-Silver Ratio (GSR) plummeted from a recent high of 97.5 to 92, marking a sharp pivot that historically signals silver outperformance ahead—a pattern reminiscent of the early 2000s bull run.
-
Massive Relative Value Opportunity: With the S&P 500 now requiring 166 oz of silver for a single share, silver remains wildly undervalued against equities, echoing the pre-2011 silver surge when just 30 oz bought both 1 S&P share and 1 oz of gold.
-
Global Central Banks Double Down on Bullion: Central bank gold buying remains relentless, with forecasts projecting 1,000 more metric tons to be added in 2025. This wave of institutional accumulation has massive bullish implications for precious metals, including silver.
-
Emerging Market Price Explosions: Silver is already hitting nominal record highs in dozens of fiat currencies, especially in emerging markets—signaling accelerating currency debasement and silver’s role as a monetary anchor.
-
Long-Term Global Charts Paint a Bullish Picture: Historical silver price charts in currencies like the Australian dollar, British pound, Swiss franc, Japanese yen, and Mexican peso all show powerful cup-and-handle formations, poised for breakouts.
-
Silver Mania on the Horizon: With echoes of the 1970s and early 1980s price explosion, a potential multi-year silver mania looms. Analysts forecast silver outperforming U.S. stocks 10-fold into the 2030s.
-
Dimon, JPMorgan Flash Bullion Signals: Even mainstream voices like JPMorgan’s Jamie Dimon are sounding alarms about sovereign bond risks and hinting at the strategic imperative to stockpile real assets—including bullion.
-
Silver’s Cultural and Monetary Role Endures: Charts from India, the Philippines, Thailand, and Hong Kong highlight silver’s long-standing role in preserving purchasing power during crises, wars, and inflationary spirals.
-
This Rally Is Just Getting Started: With silver’s spot price still well below its inflation-adjusted highs and historical performance, and institutional and retail momentum building, this breakout is not a top—it’s a beginning.
Silver Price Surges above $35/oz Hitting 13-Year High
Silver bulls celebrated a price breakout this week through the recent price resistance traced back to October 2024 that had been $35 oz, with spot closing the week close to $36 oz spot bid for silver.
Chris Marcus of Arcadia Economics pointed out this now the 3rd silver +$36 oz in US financial history. And while that is a true statement, look at the base silver is currently building versus the last two vertical price and relative value launch eras.
In a moment we'll do a deeper worldwide dive into long term silver price charts so you can visually gather a context for where silver is measured by various devaluing fiat currency units worldwide.
But in terms of nominal price record highs globally, gold prices have been consolidating worldwide of late understandably after weeks and months of up to 160+ national record price highs in respective fiat currencies simultaneously.
Meanwhile laggard silver had but a three days back in October 2024 with about 65 fiat currency record price highs for it, mostly in emerging markets where local currency repudiation cycles are faster than in larger developed markets.
We'll get into some of those multi-century silver price charts around the world in a minute.
First let's hear from CNBC-India on the significance of silver beyond $35 oz this week.
Salute to all you silver bullion bull out there who took advantage of the recent rare situation of the spot Gold Silver Ratio being above 100.
Last week's 97.5 support level I mentioned got cut like a knife this week, we'll cover where it closed later in the week's update
Basically Trump's Liberation Day spike to nearly 107, a high which basically matched the spot GSR high from 1991 has all but evaporated back to where it was prior.
Historically these kinds of spot Gold Silver Ratio spike events are followed by sharp rollover reactions downwards suggesting a large rally in silver outperforming gold is possibly now underway.
In terms of the ongoing US stock market bubble, measured by silver we're still way up top right, at nose bleed levels currently requiring 166 ounces of silver to afford 1 share of the bloated nominal S&P 500 which eked out a close this week over 6,000 nominally.
Not only do I think we get an eventual rollover akin to the 2000s silver outperforming stocks decade which peaked in 2011 around 30 oz of silver to both buy 1 share of the S&P 500 and 1 oz of Gold.
My longer thinking is we'll end up seeing a silver mania similar to the late 1970s early 1980 spike.
In such a scenario we could see silver outperform US stocks by a factor of around 10 from here to there mainly downward, stretching well into next decade, the 2030s.
This week, mainstream financial media conduits like Bloomberg published articles that basically forewarn the world that record gold buying by gov't central banks and their SWF is not slowing down.
The original title of the article had to be changed apparently after it's initial publication.
It was first headlined the blunt truth: "Central Banks Have Every Reason to Keep Buying in Gold Market". The article also highlighted a JP Morgan analyst note that stated if only an additional 1/2% of foreign US assets flowed into gold, a spot price of $6,000 oz by 2029 would be the likely outcome.
Gold market establishment consultancy Metals Focus based out of London followed that article up this week by publishing their forecast that central banks will buy another fresh 1,000 metric tons of gold reserves this year 2025 making it a fourth year in a row of unprecedented gold tonnage buying by governments.
Stating they too expect gold to hit a new fresh all time price high later this year 2025.
Stick around on the other side of this break we will look at long term silver prices around the world
and hear from JP Morgan's Jaime Dimon who is publicly sounding more and more like a bullion over bond and stock market long with recent eye raising market commentaries.
The spot silver market gained about $3 oz in trading this week closing at just under $36 oz bid.
The spot gold market had a brief climb to clear $3,400 oz intra-week but sold off to finish the week flat at $3,311 oz bid.
The spot gold silver ratio flushed downward from its 97.5 recent resistance level closing the week at a still historically high level of 92.
Allow me to remind us all where these charts have been the last year of trading, with climbing gold outperforming silver suggesting silver may have some room to run the coming second half of this year.
Before we get into potentially massive market shaking curveballs bearing down on the world, I'd like to take a few minutes to slide through some long term silver price charts that often cover over 200 years of silver price data around the world.
Starting with the long term US dollar silver price chart you are all likely used to seeing by now on this channel. The data updated through the end of April 2025. The cup silver is building as it makes its inevitable return back towards $50 oz in time.
This is a longterm silver price chart in Australia front running the shape of our future likely to come, breaking out to new nominal price highs above $50 oz locally of late.
Here is the longterm silver price chart for the British pound no longer sterling, preparing to bust out into a new silver price paradigm in time.
Here again is the yearly fiat Swiss franc silver price chart illustrating how silver prices in Switzerland still have to nominally double and a half just to meet their old 1980 nominal price high in then much stronger full fiat Swiss franc notes.
This an over 200 year Swiss franc silver price chart suggesting silver has tremendous room to run higher to come.
I promised you long term emerging market silver price charts, here is the Indian rupee measured by silver. An illustration on why silver is so intertwined into their ancient eastern culture.
This is silver in Mexican peso terms, before the Tequila crisis and local fiat currency overnight devaluation in the early 1990s. Pretty much silver has been climbing in relative value locally ever since.
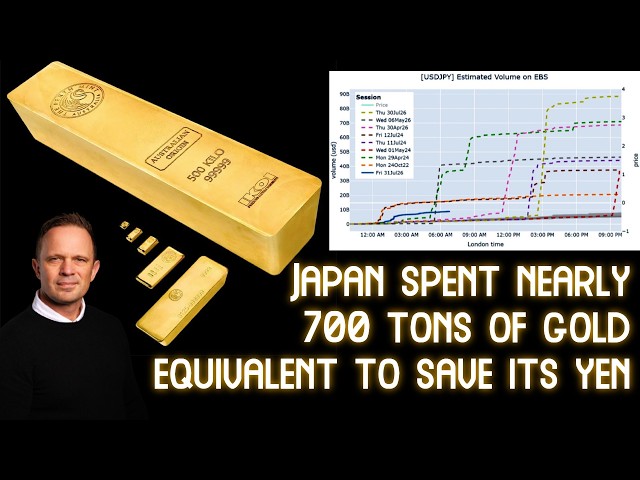
One hundred years of silver in Japanese yen terms suggest the old 1980 nominal high price is going to be passed in due time. Of note is how silver protected local's purchasing power throughout the terrible World War 2 era, a nominal price multi-folding of over 100Xs from the mid 1940s to the early 1950s, a five year timespan.
Staying in the eastern world, this is the local Hong Kong price of silver the last 75 years, a cup is again forming there.
Similar story in increasingly silver bull Singapore. The old 1980 nominal high there is nearly triple digit an oz silver in then much stronger local currency units.
Thailand silver prices post WW2 onwards.
This is the Philippine's latest silver price cup formation.
And finally the local silver price in South Africa. Protecting purchasing power over long duration of time typically.
Late last week JP Morgan CEO Jaime Dimon caught headlines with two commentaries, the first being Western stockpiling of key resources to come.
He also went on to warn the world that the global sovereign bond market is increasing danger of seizing up as long term lending rates have understandably climbed following the Covid 2020 debt issuance explosion.
The Great Taking author David Rogers Webb had some interesting commentary late last month May 2025 regarding the current parallels between now and the 1930s. It's worth wondering why so much public candor now from Jaime Dimon. What is the motive?
The thesis for our following what central banks are currently also doing, buying bullion in record size continues to build.
That will be all for this week's SD Bullion Market Update.
And as always, take great care of yourselves and those you love.
Reference:
Collapsing Bond Prices Could TRIGGER The Great Taking (David Rogers Web, May 25, 2025)
https://youtu.be/3RrwfyaWpX0?si=hKVvMSBIbok1eadc