After now, a decade and a handful of years of reckless financial policies have brought about nominal price bubbles at still dangerous levels in various major asset classes.
And after the fiat Federal Reserve’s leaders kicked off a secular price inflationary regime policy in August 2019.
They want you, me, and other financial market participants to somehow believe they can manage a soft landing of their fiat financialized asset bubble economy with a mere orderly decline in said bubbles.
We begin this week with a linear chart of the US stock market's S&P500 index over the past 100 years. Fiat financialization kicked off in the 1980s. But it was not until after the 2008 global financial crisis got papered over with more than $100 trillion in international debt levels that imaginary nominal paper wealth numbers in the US stock market blew through the roof.
In this video, we will look at a few wealth-changing rotations historical stock investors made into bullion looking backward. I don't know the future, but I can still try to align my wealth with what I believe is the probable outcome for better long-term returns.
The US stock market bubble still deludes many, and they will likely have years of sobering up to do one by one. Lost decades in real value terms are common in the US stock market's history, and my bullion bet is this decade will be better for bullion than bear market stocks.
The S&P500 is likely to close this week at around 3,700.
To retain credibility, even regular stock bulls on CNBC now have to make fundamentally driven bearish cases.
Josh Brown did so twice this week elegantly. Have a look and a listen to this week’s SD Bullion Market Update video.
To Josh's point about the problematic situation with the US housing market, mortgage rates have had their most significant fastest climb since 1987.
Monthly payments to finance average new home 30 yr mortgages have more than doubled since Jan 2021, going from a monthly cost of $1,294 to $2,671 per month to service a then versus now 30 yr mortgage rate in May 2022.
The fiat Federal Reserve increased its Fed funds rate by 75 basis points or three-quarters of a percentage this past week, moving its fiat Federal Funds interest rate to a range of 1.5 to 1.75%. This supposed aggressive action was taken while understated official price inflation rages at 8.6% year on year.
While real price inflation is likely in real fiat $USD value loss terms, already in the middle teens or higher year over year.
The critical thinking world should preposterously look upon this week's fiat Fed rate hike as if it is supposedly fighting price inflation.
Even past financial bubble creators chimed in with former fiat Fed Chairman Ben Bernanke stating the following gibberish nonsense of yore.
That settles it for me. If I had any doubt we're headed for a stagflationary-like 1970s period, it's now gone. https://t.co/XG9JTYx4if
— fred hickey (@htsfhickey) June 14, 2022
Bernanke’s comment completely ignores the unknowable psychological line we are nearing, where the masses lose complete confidence in fiat currency as a reliable store of value.
I would suggest to longtime tech analyst and gold bull Fred Hickey that we'll be lucky to see only 1970s-style price inflation with what the fiat Federal Reserve has done to the now-massive US dollar M2 currency supply.
We've never done currency expansion like this in our nation's modern history. You would have to go back to the US Civil War's fiat Greenback era to find data points that are more highly fiat currency expansionary.
Thus far in 2022, the US stock market has been near record-breaking in losses made. If the 2022’s stock market losses ended here, it would be the 7th worst year on record. And again, we are not even halfway through the year yet.
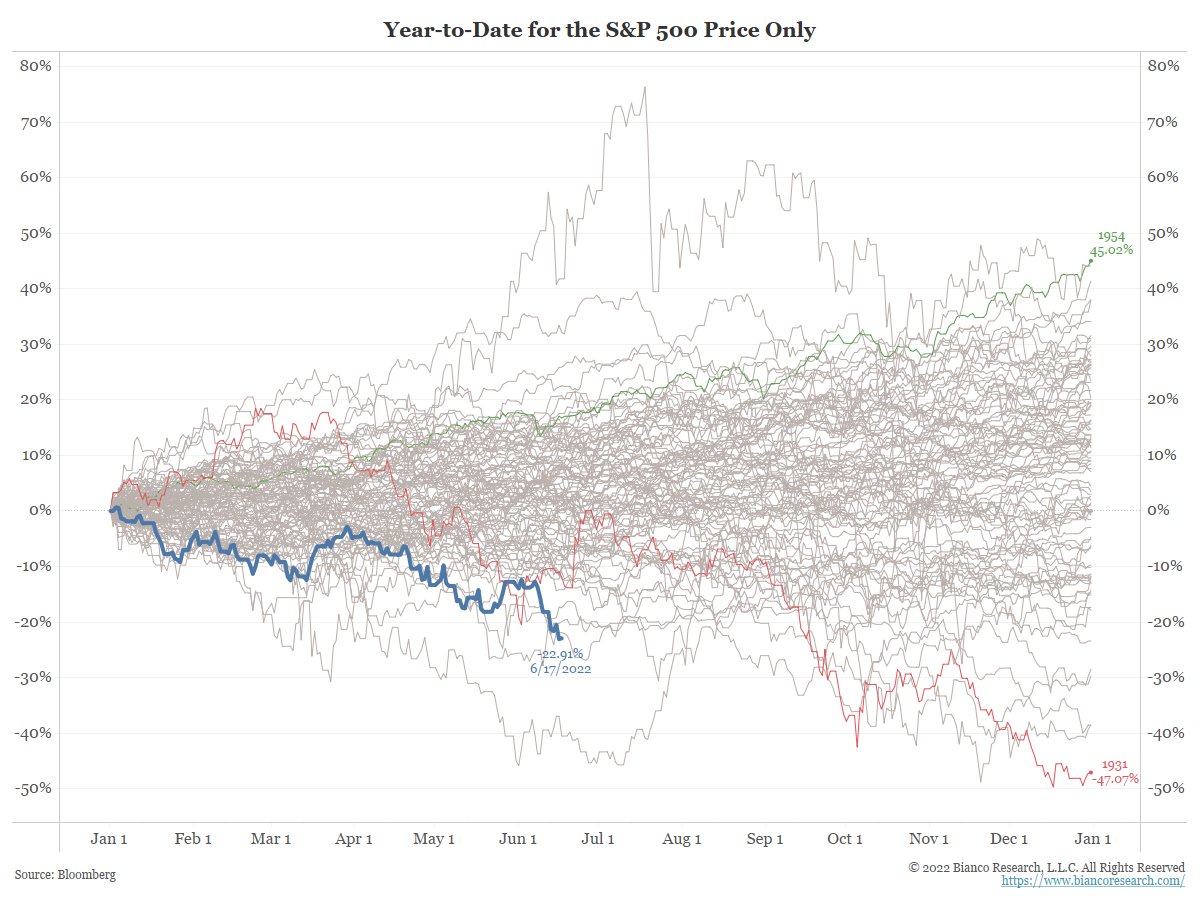
SOURCE - https://twitter.com/biancoresearch/status/1538159906108411904
Large institutional investors, 60/40% of stock/bond mix model portfolios, continue to get crushed in relative value losses.
In the face of this all, gold bullion has yet to bull mania up a wall, but it has at least stayed flat and slightly positive in the face of terrible financial market fundamentals.
Oh, and this week Jerome Powell almost explicitly admitted we as a nation are fiat CDBC bound.
The gold market's run to 1,900 got thwarted first thing to start this week, getting capped at $1880 oz, as the price of gold appears to be closing this week just shy of 1,850 oz ask price.
The price of silver consolidated sideways with failed attempts to clear $22 oz toward the close of this week.
The gold-silver silver price ratio sits around 85 at the moment.
I want to close this week, having not finished my point about what a potential beatdown the US stock market has come to in real bullion value terms.
This week we end by looking at long-term charts reflecting the price of gold divided by the then S&P 500 US stock market index since the post-World War War 2 era. Yes, back to when the United States had nearly all its infrastructure intact, with over 20,000 metric tonnes of gold bullion and the wind at its back.
The Nifty-50 stock market bull of the 1960s eventually gave way to a super cycle in commodities and the stagflationary 1970s, where the price of gold 24 folded from bottom to top.
Those who traded out of US stocks into gold at the time they enjoyed two bull runs for bullion throughout the 1970s.
While the first 2000s bullion bull run in outperforming stocks is behind us, my contention on this chart is the second run is now set up for this decade into perhaps even the next.
If we simply get back to levels reached in 2011, we would have gold bullion outperforming the S&P 500 by a factor of three. But that is base conservatism for me.
Given that we are not popping some of the craziest financial bubbles ever blown, it would not shock me to see gold outperform the S&P 500 by a factor of ten here to its eventual future peak. Of course, always take profits along the way, for I do not know the future, and neither do you.
But the potential for outperformance while preserving wealth is still staggering for gold over US stocks ahead.
The setup for silver to outperform US stocks gets even more ridiculous from here to somewhere up there.
Suppose silver merely returns to its 2011 level on this chart, which is my conservative base case. In that case, we're talking silver outperforming the S&P500 by a factor of over 6, whereas silver gets eventually manic on the upside and overshoots after decades of systematic value suppression. The possibility of silver outperforming US stock by some 20-fold this decade into the next is within historical reason of mimicking.
Again I don't know the future, and neither do you. But a prudent bullion position makes potential high-value gain sense versus the beginning secular bear market opening up in the broad global bond, US stock, and fiat currency valuation trends of late.
For me, gold and especially silver bullion are asymmetric bets against fiat financial bubbles coming undone this decade into the next.
That is all for this week's SD Bullion market update.
As always to you out there, take great care of yourselves and those you love.