



Precious Metals Prices Today


Precious Metals Prices Today
Precious metals offer an investment that provides the means to weather economic storms and retain value when all else fails.
We provide you with access to gold and silver prices updated every 10-15 seconds to ensure that you always have your finger on the pulse of the market and can make smart decisions with your money.
Not only do we ensure accurate information about the current price of gold and silver, but we also deliver additional information to help you make savvy decisions about physical precious metals.
Precious Metals Prices and the Need for Accurate Information
Precious metals prices might not change as drastically or as frequently as stock prices since they’re not tied to the vagaries of confidence, company performance, management decisions and the like, but it is vital that you have access to accurate precious metal prices at all times. To that end, we offer free access to metal price chart options for all the major segments including live gold prices, the dynamic silver price, platinum prices, and palladium prices too.
We also regularly update the important Gold Silver Ratio so investors can perhaps better deduce which of the two monetary metals is historically under or overvalued. Without access to the current price of gold and silver today, it is impossible to make sound decisions to build your wealth and safeguard your quality of life in the future. Seasoned investors understand the importance of not just the spot price, but correct price quotes for buying silver bullion and in order to buy gold bullion.
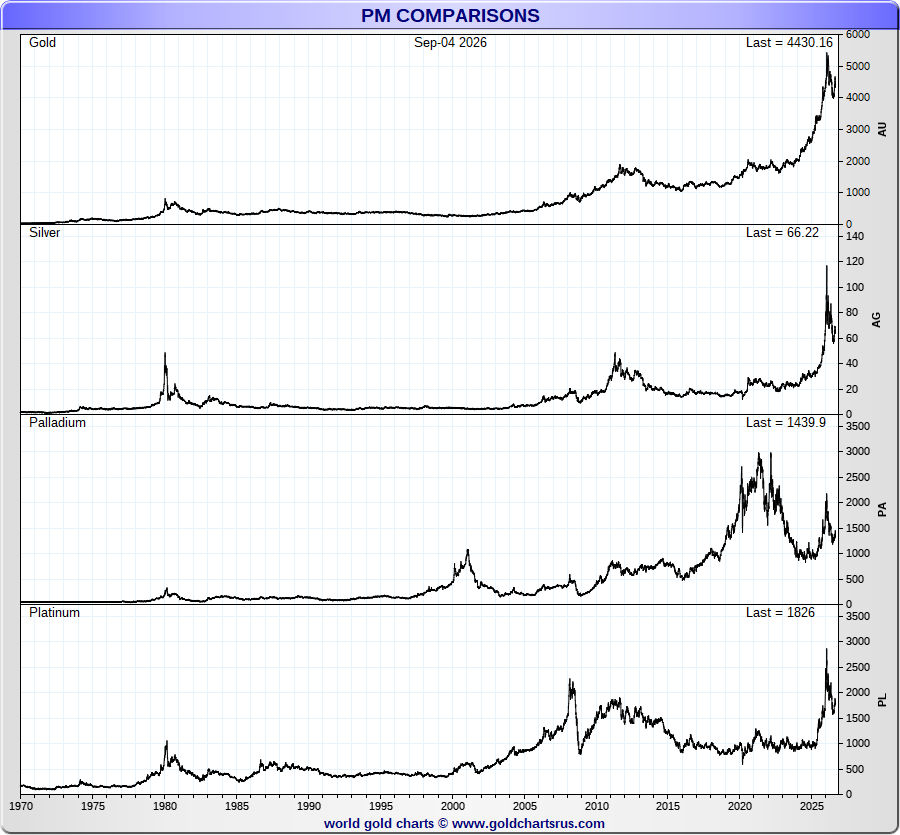
However, it is also important that investors understand the myriad of ways to invest in gold and silver, as well as other precious metals. The following is a long-term view of Gold, Silver, Platinum, and Palladium prices in US dollars spanning from 1970 to 2026.
Long Term Precious Metal Prices in U.S. Dollars
In the chart above, you can find the per ounce US dollar prices for Gold, Silver, Palladium, and Platinum respectively from 1970 to 2026. Given that this is a static chart, we will be updating it every quarter in the months and years to come. For now, this long term precious metal price chart above will give you a better understanding of various past precious metal bull markets (1980 being the most obvious) as well as isolated bullion bull markets for palladium in 2001 for instance.
About Our Precious Metal Price Chart Options
When making an investment in precious metals, it is important to always understand primarily which specific fiat currency is being used to measure against which specific precious metal. Given that we are a US-based bullion dealer, our precious metal price charts are almost always US dollar-based. And secondarily, one must always take into consideration the timeframe being depicted in a precious metals price chart.
Different precious metal price charts may highlight avarious time periods. They can range from mere minutes to a 24-hour period, to various weeks, six months, a year, a decade, or even over 100 years. With precious metals, it is important to remember that movements over a short period of time are usually just minor fluctuations.
The Difference Between Short-Term and Long Term Gold Price Views

1 Week VS. 1 Year

For instance, the price of gold may rise or fall only a few dollars per troy ounce during a week, or over the course of a month. However, this information is secondary to what you actually need to see. It is more important to consider long-term precious metal prices. That is, how has gold performed over not merely a year, but perhaps a decade or more? What is the trend for gold and silver prices over the course of the coming decades even?
By looking at longer-term time frames, you can make wiser decisions based on longer-term price movements and trends, rather than short-term price variances caused by minor events that could soon self-correct. If you were to only look at precious metal prices during these short term price variances, you might be tempted to sell bullion or even avoid buying bullion completely. But when you study the price of silver and gold for both short and long-term movements, you can better learn how to spot the longer-term secular trends.
So, not only is it important to know the spot price of gold or silver (the live dynamic paper and physical prices), but it is crucial that you understand how these prices have moved over longer time periods.
The Nature of Your Investing
Most of those interested in live gold and silver prices are investing for the long term. However, there are plenty of investors who want to get in and get out. This is where a technical analysis of a metal prices chart combined with a number of other essential tools can provide you with the means to determine where the metal is going next, and whether now is a right time to get in or get out while making a potential profit or loss.


Our Stance
We believe that the best way to reap rich rewards from physical precious metals investing is to make smart investments over the course of time – small disciplined bullion purchases at regular intervals. Of course, this really only applies if you’re purchasing precious metals physically. If you’re buying ETFs or other intangible assets, the situation is different with additional myriad counter-party risks involved.
Our goal here is to ensure that you always have access to not only the live gold and silver prices but also the historical price performance of these precious metals to inform your investment decisions for the long term.
For instance, the following Gold and Silver +70 Year Charts begin in 1950, spanning up to today.
Within these long-term gold and silver monthly price charts you can deduce monthly averages for each respective precious metal in US dollars per troy ounce increments. If you would like to dig deeper into daily gold price history and daily silver price history we also publish this day-to-day price data for each respective monetary precious metal here at SD Bullion.
How do gold and silver prices compare right now?
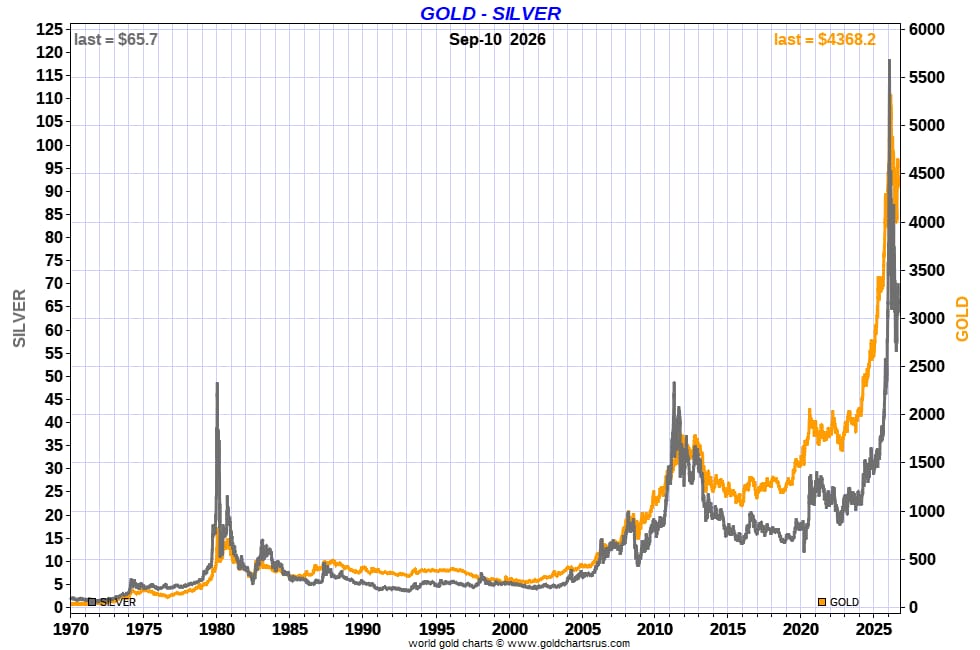
Gold and silver often move in tandem but trade at very different price levels. As of September 1, 2026, gold trades at $4,328 per troy ounce, while silver trades at $64.69 per troy ounce, resulting in a gold-to-silver ratio of approximately 67:1. The gold/silver ratio measures how many ounces of silver are required to equal the value of one ounce of gold and can provide useful historical context when comparing the relative prices of the two precious metals.
You can track the live gold to silver ratio on our dedicated ratio page as market prices change. For the latest silver spot price and market movements, visit our live silver price page.
Is silver a better investment than gold right now?
Whether silver or gold is a better buy depends on your goals and the current gold to silver ratio. Silver offers higher percentage upside potential and has growing industrial demand from sectors like solar energy, while gold provides deeper liquidity and a longer track record as a monetary reserve. Many investors hold both, typically allocating 5–15% of a portfolio to precious metals overall. Platinum and palladium are worth considering for further diversification, particularly for investors tracking industrial demand cycles.
How much is 1 oz of each precious metal right now?
As of September 1, 2026, approximate spot prices per troy ounce are: gold at $4,328, silver at $64.69, and platinum at $1,732. Precious metals prices fluctuate throughout the trading day, with prices updating every 60 seconds at the top of this page. For more detailed price charts, historical data, and market information for each precious metal, visit our individual gold price, silver price, and platinum price pages.
What is a good portfolio allocation for precious metals?
Most financial guidance suggests allocating 5–15% of an investment portfolio to precious metals as a hedge against inflation and economic uncertainty. Within that allocation, many investors weight gold most heavily for stability, silver for upside potential, and add smaller positions in platinum or palladium for industrial demand exposure. The right split depends on your risk tolerance and time horizon. Physical bullion — coins and bars — is generally preferred for long-term holdings over paper instruments like ETFs.
This information is provided for educational purposes only and should not be considered financial or investment advice. Before making any investment decision, consider consulting with a qualified financial advisor who can evaluate your individual financial circumstances, investment objectives, and risk tolerance.
What are the all-time high prices for gold, silver, and platinum?
Gold, silver, and platinum each reached significant historical highs in January 2026. Gold reached an all-time high of approximately $5,589.38 per troy ounce on January 28, 2026. Silver reached an all-time high of approximately $118.45 per troy ounce on January 29, 2026, while platinum reached an all-time high of approximately $2,792.00 per troy ounce on January 29, 2026. Precious metals prices fluctuate continuously, and historical performance does not guarantee future results.