

As we ready to enjoy the holidays, and to pass through these final weeks of a year none of us will likely ever forget.
This week, we look at what may be in store for us, early in the coming year 2021.
As precious metal bullion bulls are further setting up, to reap rewards from years of positioning and patience.
As politicians in Washington DC squabble over what amount of crumbs they may issue to US citizens, only has to look at the record-sized explosion in the fiat US Dollar’s M1 pile to know that the 2008 Global Financial Crisis was a mere speed bump to the Great Reset events unfolding.
Let’s also quickly look at the also exploding M2 aggregate pile for a larger context of what is happening without a full explanation as to why.
Here you see a quick definition between M2 vs M1.
This even larger pool combines not nearly fiat currency in circulation, demand deposit accounts, but also near-money items like savings accounts.
Look at the growth of M2 back when these three lied to us all, versus now in 2020 for context.

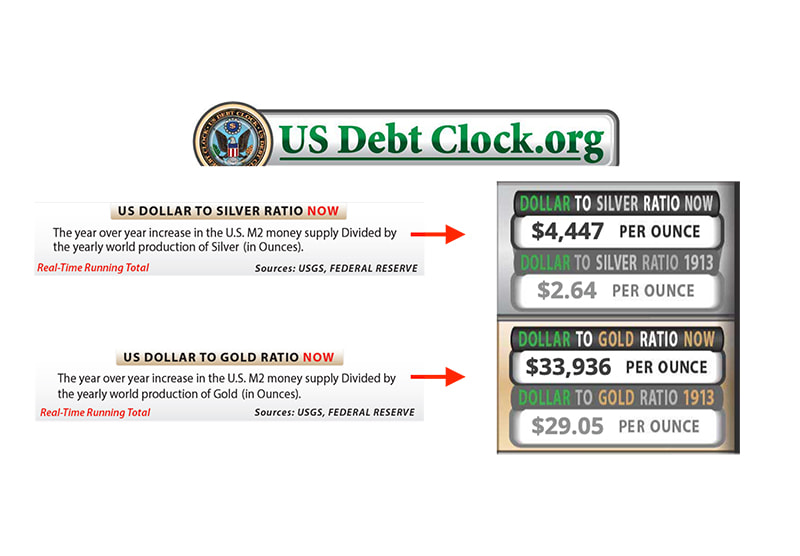
Even more ridiculous is a website we have cited before on this channel which uses M2 growth divided by fresh gold and silver supplies for the year to deduce a relative valuation.
And we now have hyperinflationary silver and gold price targets shown on the Debt Clock website in real-time.
Hopefully, you took advantage of the last three months and a bit more silver and gold price consolidations.
We are setting up for a robust price breakout event soon enough. Just about 10 days ago, I asked the following question on my Twitter feed regarding how silver spot prices and gold spot prices denominated in fiat Federal Reserve notes might end this year 2020.
The majority of the hundreds of responses were short-term bullish, looking for gold to clear $2k and silver to push beyond the technically important $26 oz level.
--
This is the Gold Silver Ratio since the viral crisis took hold of the world economy in 2020.
Technically it looks bound to dip below 70 spot price ounces of silver to afford one spot price runs of gold soon.
Backing out the timeframe of this chart, looking at this 21st Century bullion bull in context.

The next year 2021, it would not surprise us to see a run back down towards the 50 levels for this key precious monetary metal ratio. And before this bullion bull goes manic, to see the Gold Silver Ratio low of 33 in the year 2011 get passed in the twenties and perhaps even lower.
Bearish price action and headlines keep dumping on the fiat Federal Reserve note in comparisons to other major devaluing fiat currencies like the Euro, Yen, Pound, and Yuan.
Quite possible we end the US dollar’s last 5 years of relative strength and enter a prolonged bear market in relative declining fiat USD values.
-
Looking out at next year, we must look at the record-breaking store of value precedent both gold and silver markets set this year, and extrapolate for what more might be coming up.
Reuters was out this week with a sigh of relief for the physical gold market, now that the COMEX is not currently hovering up all-new gold bars refined and issued out of the world’s gold refining nation of Switzerland.
You can see the explosion of US Gold bullion bar imports from Switzerland represented in the tall blue bars bottom right hand of this chart.
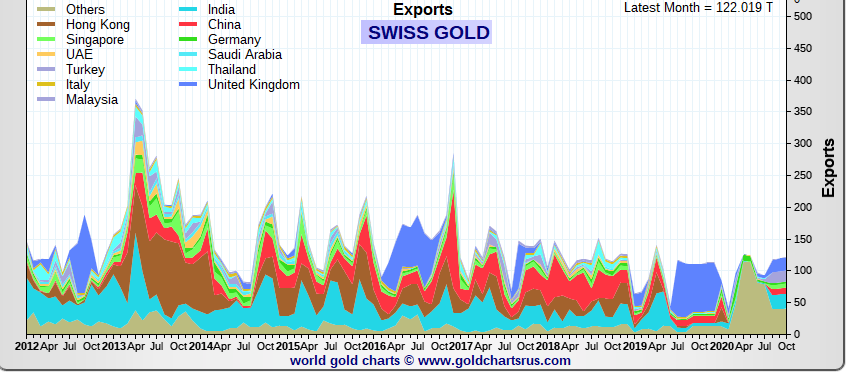
The United States is on pace to import over 500 tonnes, more than 16 million troy ounces of gold this year from Switzerland alone. Likely all newly refined bars. Valued at around $30 billion in current market value.
Typically the USA was such a weak Swiss gold importer, that Nick Laird’s Gold ChartsRUs website had them filed in the OTHERs section of this chart’s key. You can see the US’ golden import explosion began around March this year.

Turning to stark changes in the physical silver market in 2020 and likely ahead. The Silver Institute published forecast data for the year citing the massive increases in both physical silver bullion buying as well as in exchange-traded products.
Year on year, the silver market lost about 50 million ounces in annual mine production, while around 587 million ounces of silver were bought for a store of value bets.

I cannot overstate how ridiculously large that combined number is. Almost 2Xs the bets made in 2010, the same year QE1 wind-down and QE 2 began.
I will pause here briefly so you can see the silver store of value demand 2020, in context versus the 2010s and 2010 specifically.

This as the silver market is on the verge of blowing through the key $26 per troy ounce spot price level.
That is all for this week.
Happy Holidays to everyone out there.
As always, take great care of yourselves and those you love.


