

Interesting things are happening in the gold market, and many explanations for what's going on are equally valid.
For example, some may say "gold is consolidating in preparation for its next move higher". This is valid as the paper price of gold has basically traded between $1,700 and $1,750 since mid-April.
Others could say gold is "stuck in a sideways channel", and that is also true. Perhaps there is, on net, balanced hope and despair in the economy, which is not causing a flight into, nor out of, gold.
Others still could say gold has been "correcting over time, not price", and that would also be true. As investors re-position their portfolios, one of the things that looks very good in a portfolio right now is gold, so shallow dips have been bought, as is done in bull markets, and it's highly likely that deeper pullbacks would be met even more aggressive buying.
Furthermore, if gold loses support at $1,700, there is still stout support at both $1,675 and $1,650:
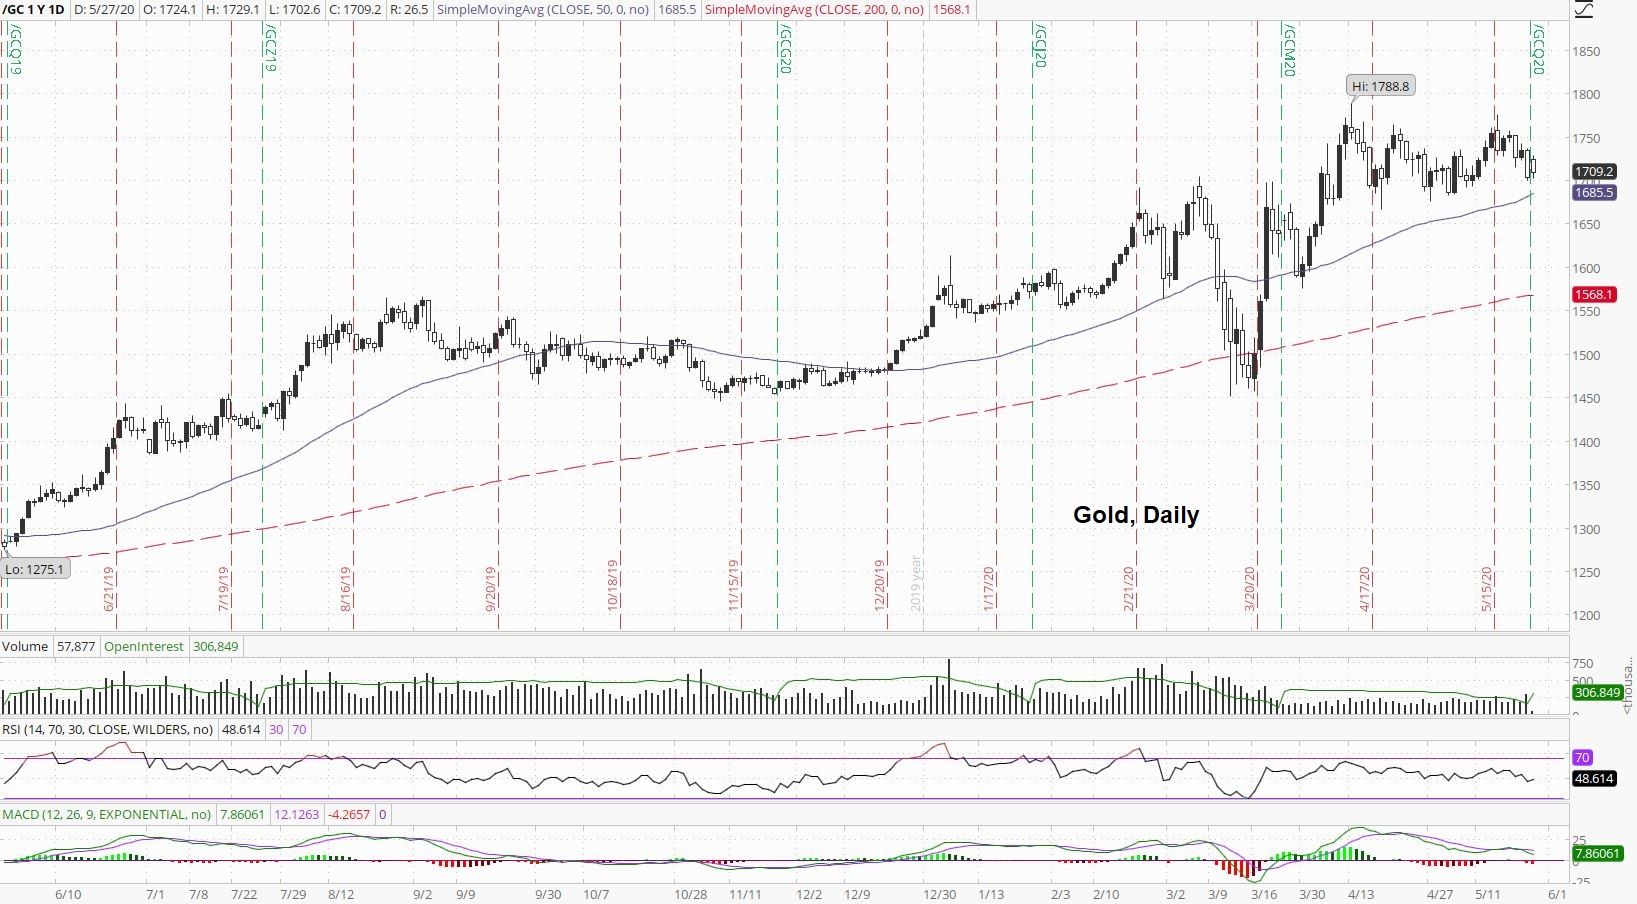
Something that people have been making note of, however, is the lower trading volume, which began in late March.
For investors of real, physical metal, it is interesting that some are noting the low trading volumes as a sign of weakness, but all things considered, "paper" trading volume may be lower, but demand for real, physical metal is still blazing hot.
In fact, news has come out over the past couple of days indicating blistering demand for gold bullion, such as Perth Mint gold sales surging in April, and gold exports from Switzerland to the U.S. setting a record, also in April.
All things considered, gold has been bid, gold is bid, and gold will continue to be bid.
Real, physical gold, that is.
Which brings us to silver, which is in a very interesting place compared to gold right now.
For example, if we assume gold has been consolidating over time, this gave silver the opportunity to begin playing catch-up to gold, which can clearly be seen in the plunging paper gold-to-silver ratio:
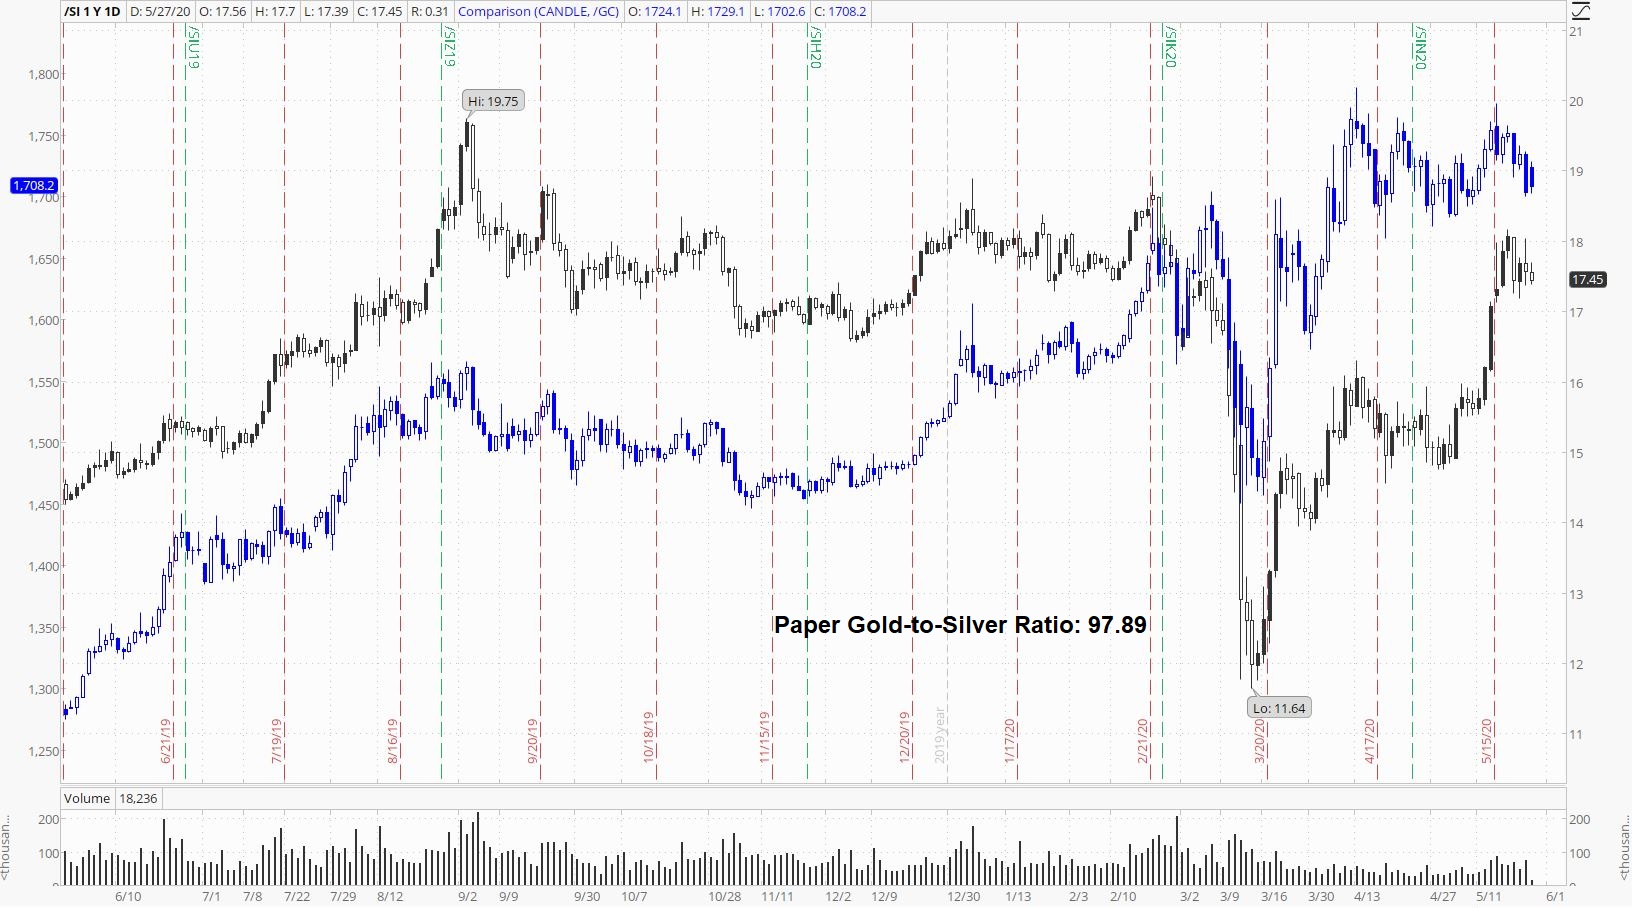
Recall we were following the sideways channel of between 110 and 115 for several weeks, and then over the course of about a week, the gold-to-silver ratio plunged below 100.
And now?
Well, no matter which direction the gold-to-silver ratio heads in the short-term, it sure is exciting!
Adding to the excitement is that there seems to be about equally balanced arguments given for silver prices from both the bulls and the bears:
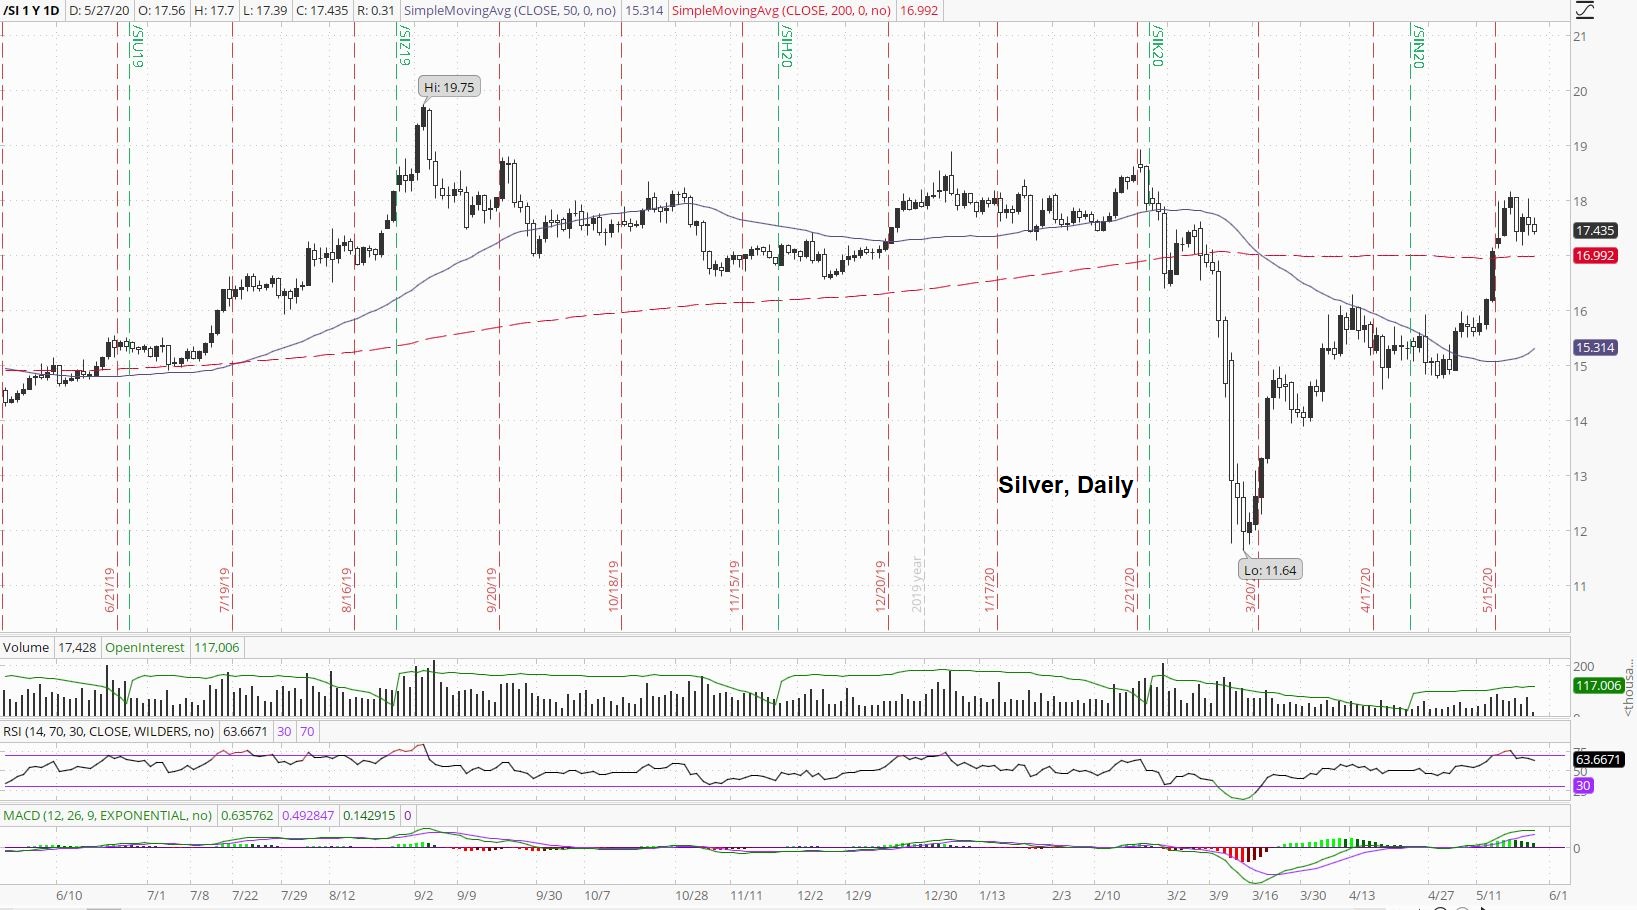
While the bulls have been impressed by the authoritative break-outs above two major moving averages over the course of May, the bears are quick to point out that the moves happened quickly, resulting in "overbought" conditions.
For those keeping score, silver opened 2020 at $17.90.
Palladium's daily chart looks at all kinds of messy as we approach the midway point of 2020:
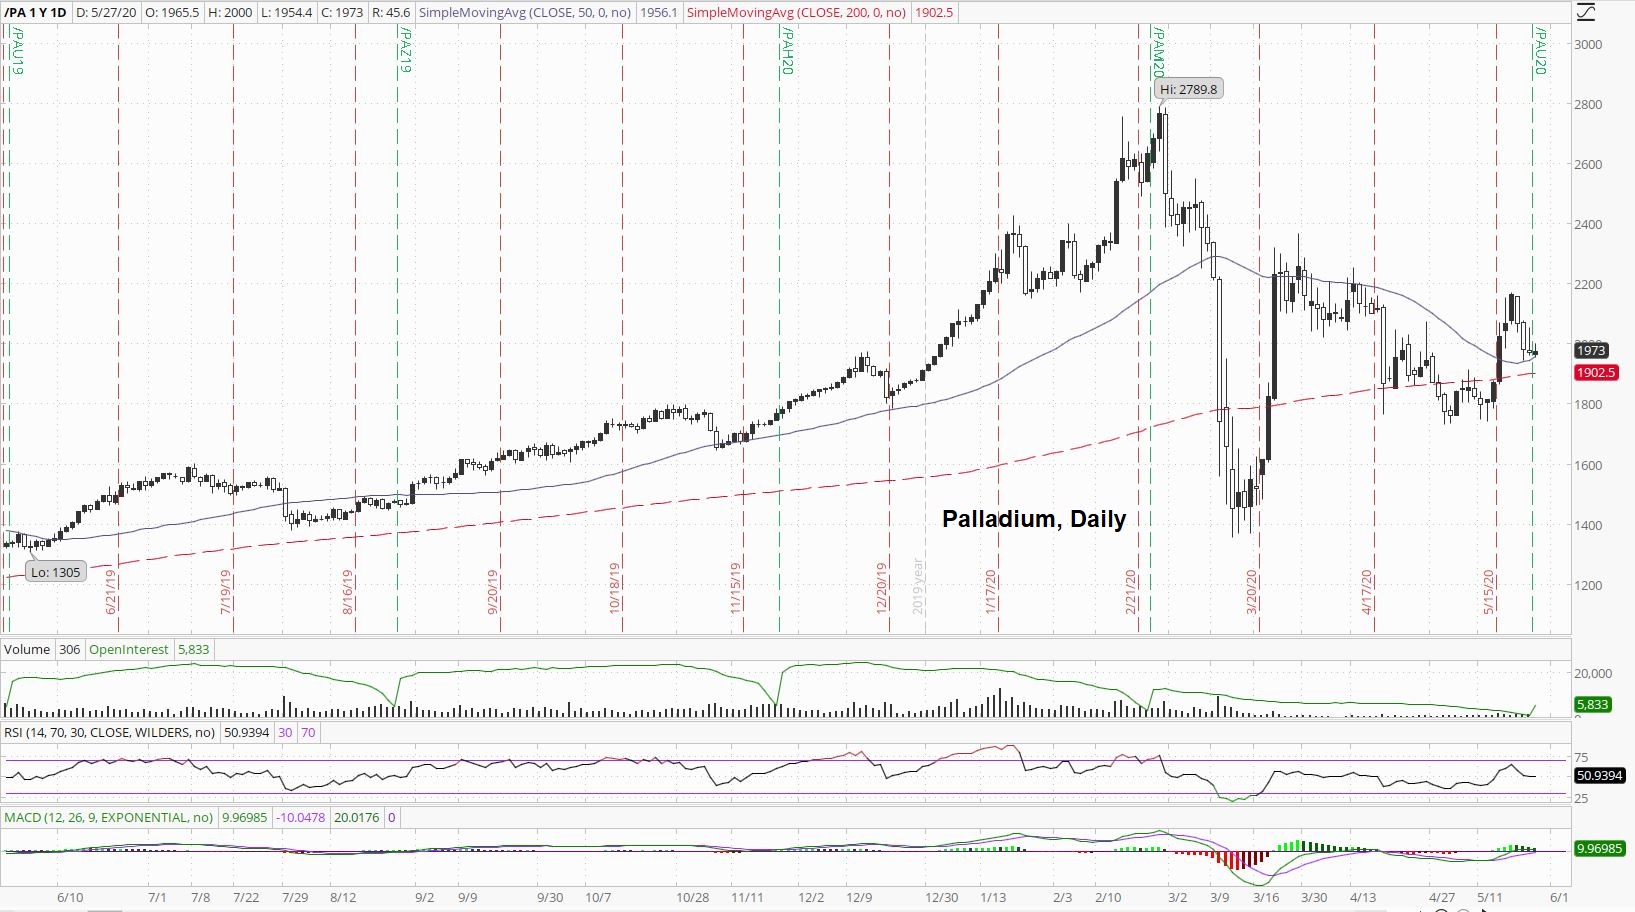
Palladium is barely positive on the year, however, and palladium has had some very broad price swings post-crash, mostly between $1,800 and $2,200.
Platinum is behaving a lot like silver:
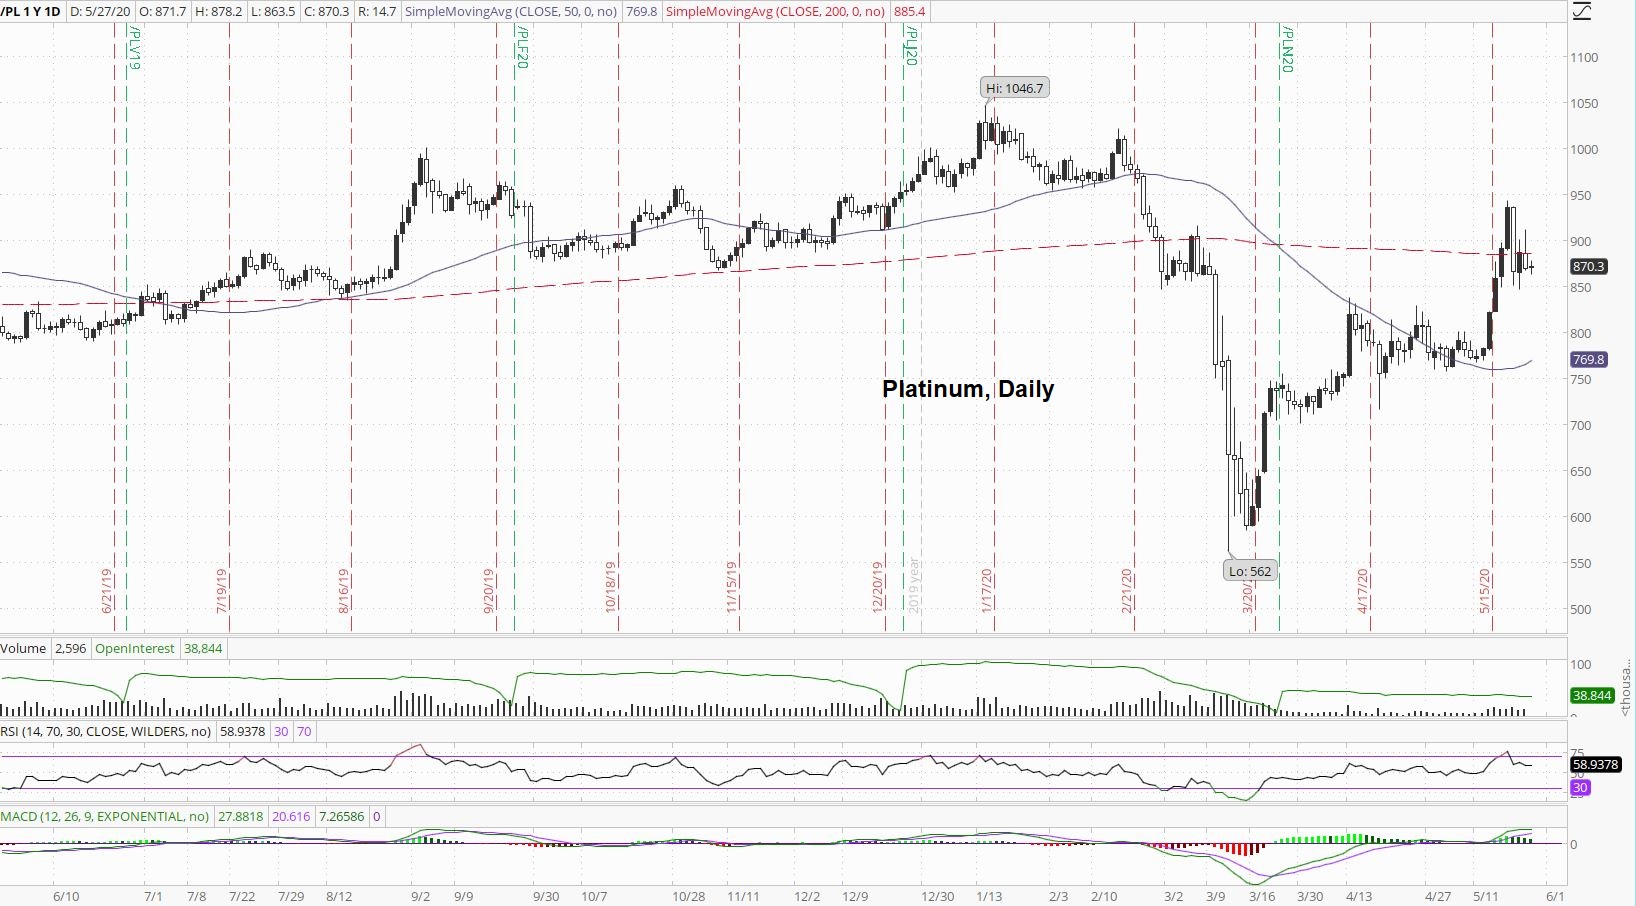
Platinum's behavior is very interesting indeed because if we are in fact entering a global depression, the logic generally goes that demand for industrial metals decreases, which is generally true, however, in platinum's case, we can clearly see a "flight to safety" bid taking place for platinum's monetary properties.
Furthermore, at platinum's current price point, deeper-pocketed investors would not be wrong to look at platinum as the value investment here.
Of course, humble Silver Bugs may disagree!
Copper appears to be "climbing a wall of worry" right now: 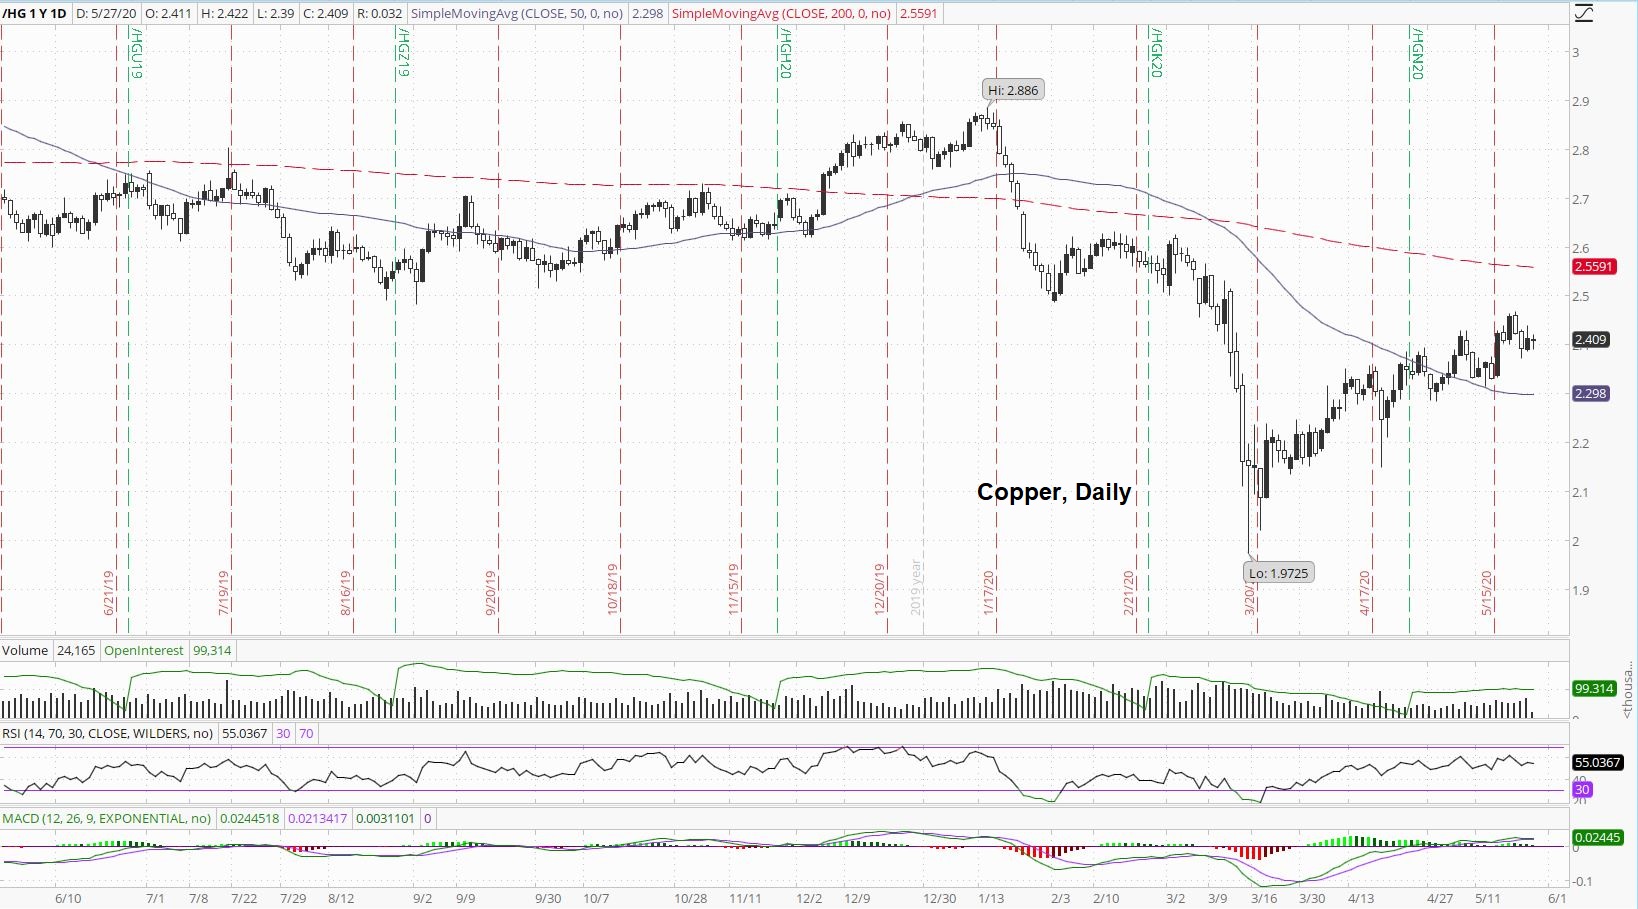
It is, after all, hard to argue against the series of higher-lows and higher-highs.
Crude oil has stopped short of "filling its gap":
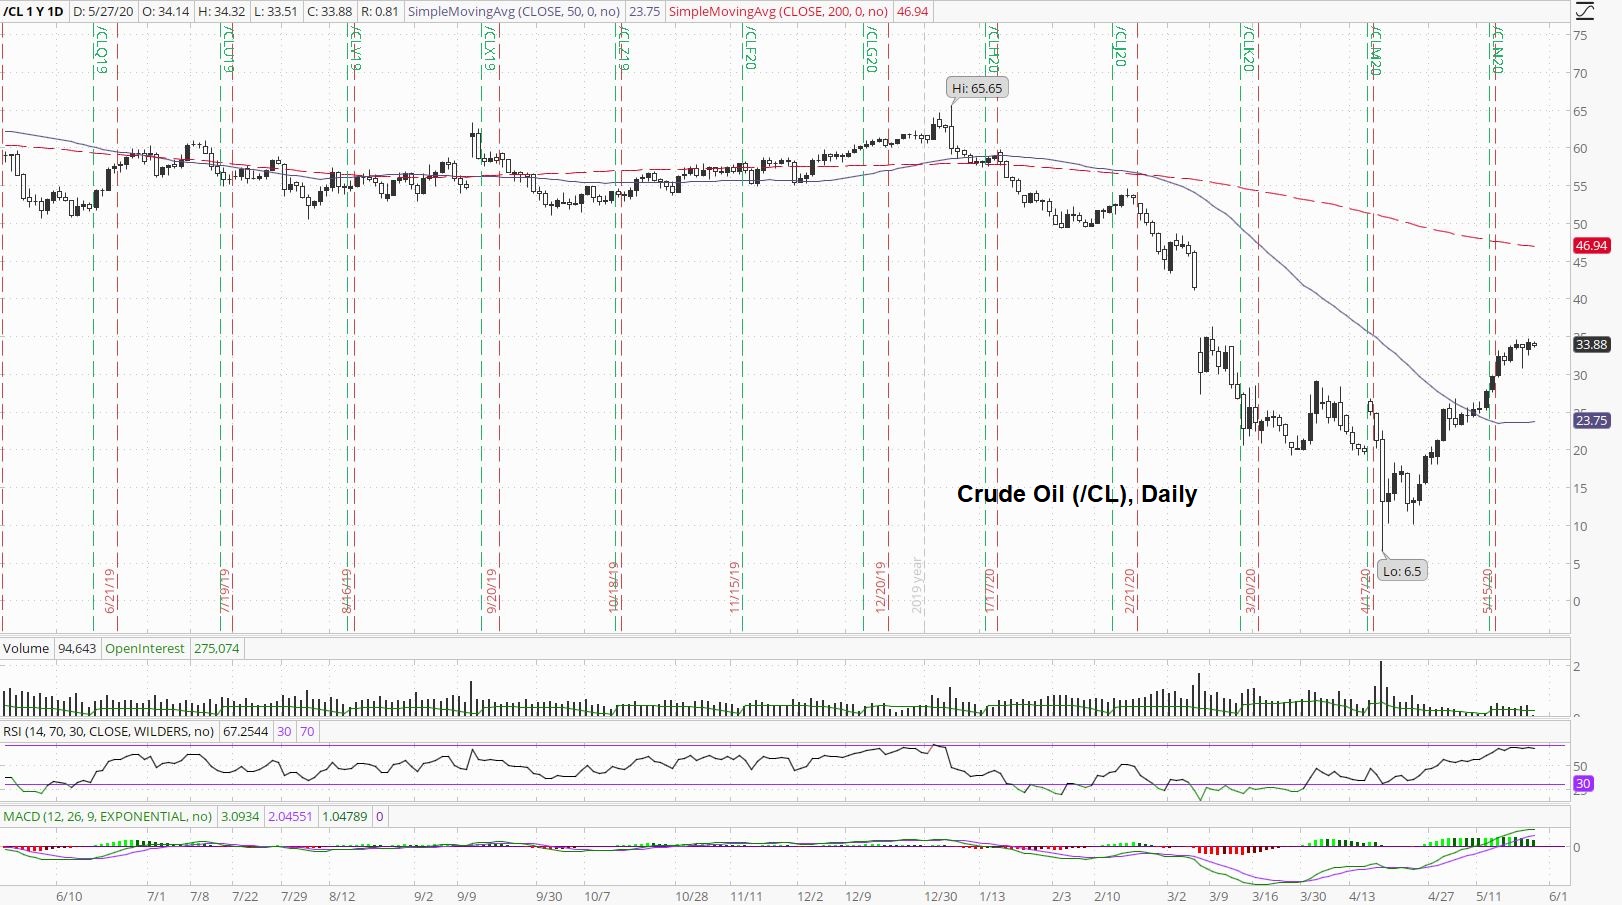
Of note is just how little movement there has been in the crude oil price over the last few days.
The stock market is a stone's throw away from all-time record highs:
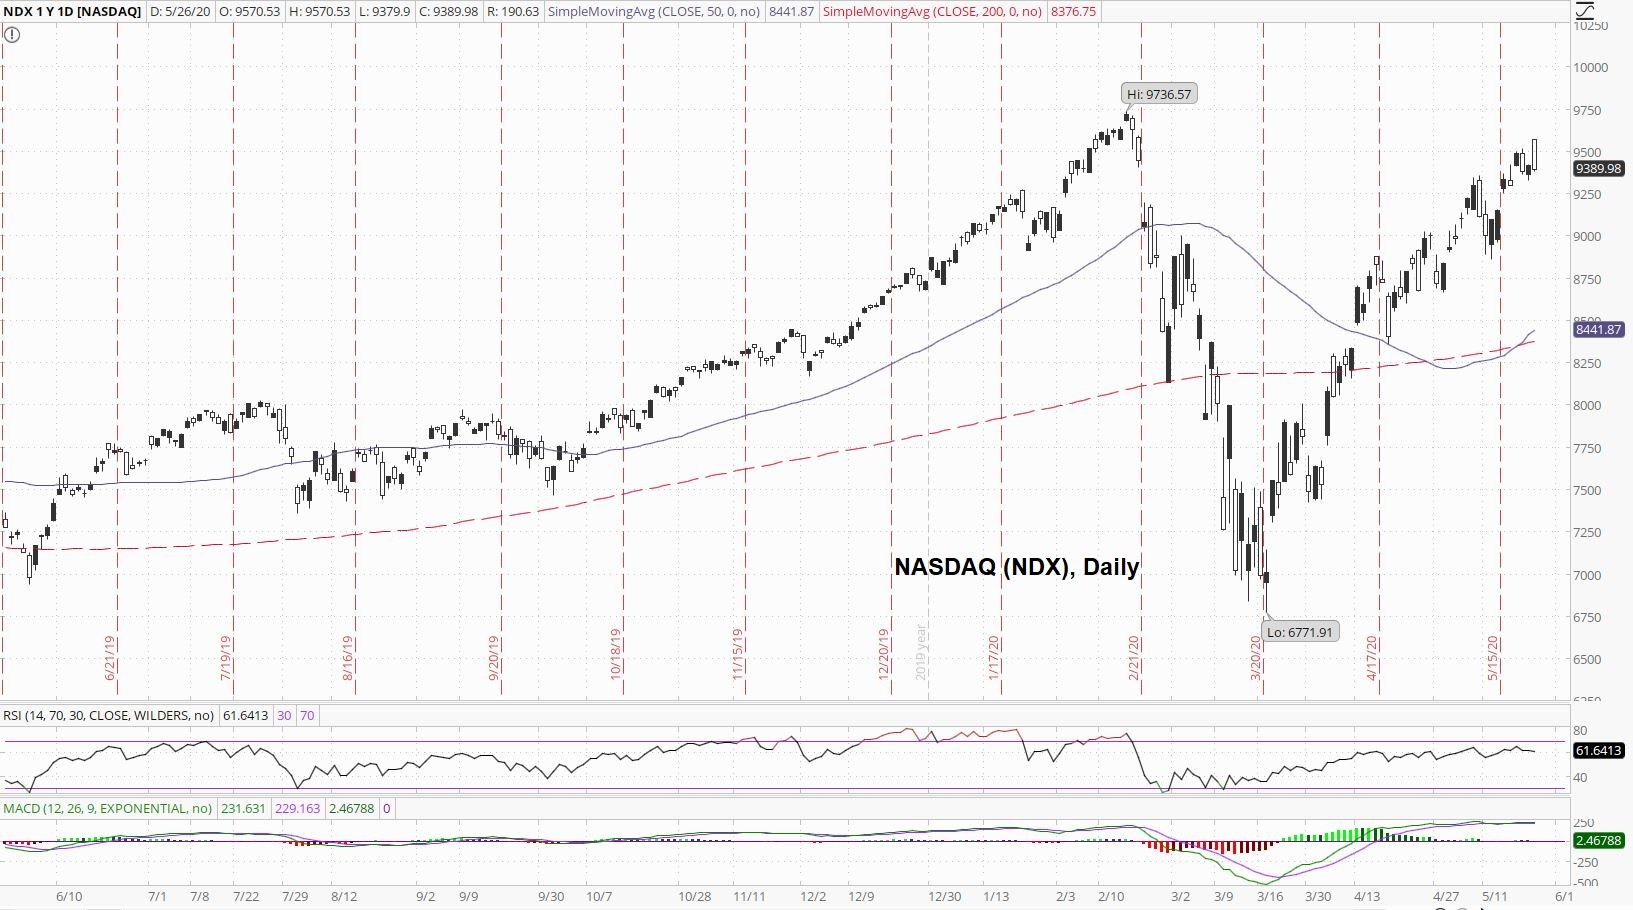
There is also a "golden cross" where the 50-day moving average crossed through the 200-day moving average, which, generally speaking, is bullish.
The question is, will Main Street catch-up to the stock market, will the stock market catch-down to Main Street, or can the stock market and Main Street move independently of each other?
The VIX has continued its grind lower:

With the Fed coming to the rescue of the market, perhaps traders and investors see no need for downside protection?
The yield on the 10-Year Note continues to be rangebound between 0.6% and 0.7%:

Here's the question: What will happen to yield on the 10-Year Note if the stock market has not seen its final bottom?
Finally, the US Dollar Index is looking more bearish by the day:

Since early April, we have two lower-highs, and if the DXY breaks down here, we will have a second lower-low.
Interestingly, the dollar may come back into the mainstream financial discussion again as it appears tension with China, which now goes beyond the trade war, is increasing.
Thanks for reading,
Paul Eberhart


