

Over the course of the last week, there have been several economic data releases and market events that have all been historic in nature.
For example, on Friday, we learned that over 20,000,000 people lost their jobs in the month of April alone. Also, last Friday, the market's Implied Fed Funds Rate went negative for the first time, ever. The record-breaking didn't stop on Friday, however. For example, just yesterday, Tuesday, May 12th, core CPI crashed by the most ever, and we also learned the US Federal government racked-up the largest one-month deficit in April, coming in at nearly $750 billion, which means three-fourths of a trillion dollars was added to the US National Debt, in just one month!
Also noteworthy, just yesterday, the Treasury announced that the Fed would begin it's ETF purchases, conducted through the New York Fed. Speaking of the NY Fed, the latest GDP Nowcast, produced by the NY Fed, currently estimates second-quarter GDP at -31.22%.
The bottom line is that everything we've been seeing in the markets and the economy is truly historic in nature, and with such an abrupt halt to so many sectors of the economy, all at once, now that we're several months into 2020, it does seem like the really bad economic data is pouring in with each new release, and it seems like this will continue at least throughout the month.
Curiously, many analysts and experts are discussing the recovery, but suffice to say the economy hasn't even stopped crashing just yet.
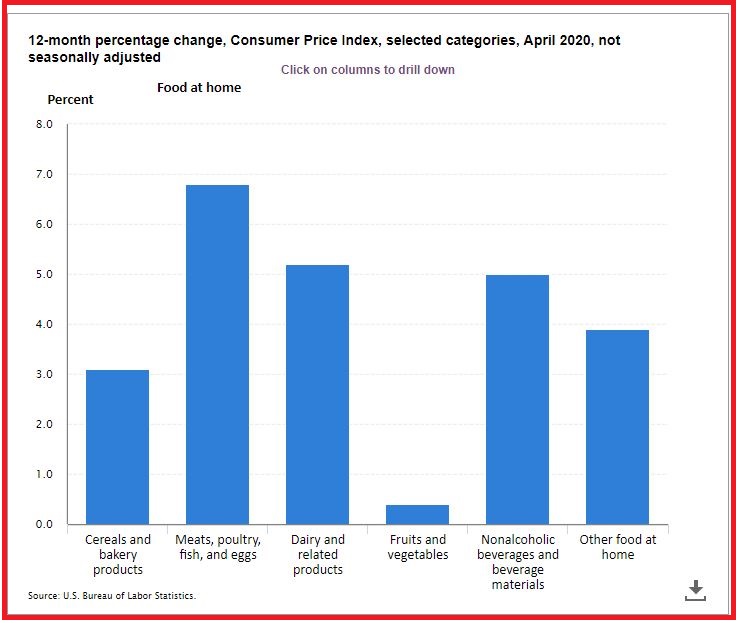
Let's discuss one of the data releases in a little more detail, the US Government's inflation data (CPI), and let's hone-in on one particular part of it: Food.
The national supply chain disruptions continue, especially in big agriculture. These supply chain disruptions, among other things, are adding inflationary pressures to the price of groceries in general, and especially for certain types of groceries, such as meat and dairy.
Indeed, in the latest Consumer Price Index, released yesterday, in which Core CPI crashed by the most on record, the "Food at home" Index increased 4.1%, while the price of meats rose by 6.8% and the price of dairy rose 5.2%, as shown in the table below:
Some food for thought, pun intended, is in that same speech in August of 1971 that Gold Bugs know so well, President Nixon announced 90-day "wage and price controls" across the entire United States, meaning all prices and all wages were frozen, by order of the president, for three months.
Here's the interesting part, and I'll ask it as a question: What was the CPI when the freeze was announced that Sunday evening forty-nine years ago?
It was 4.0%.
Here's the question many like to argue, discuss and ponder, which is about to become something that will surely be on pretty much all of the People's minds moving forward, whether the People think about it this way or not: Does the US government actively understate price inflation, and if so, how does the government do it, why do they do it, and how has the government's inflation data methodology changed over time?
Over time, many are expecting the gold-to-silver ratio to revert to its historic mean:
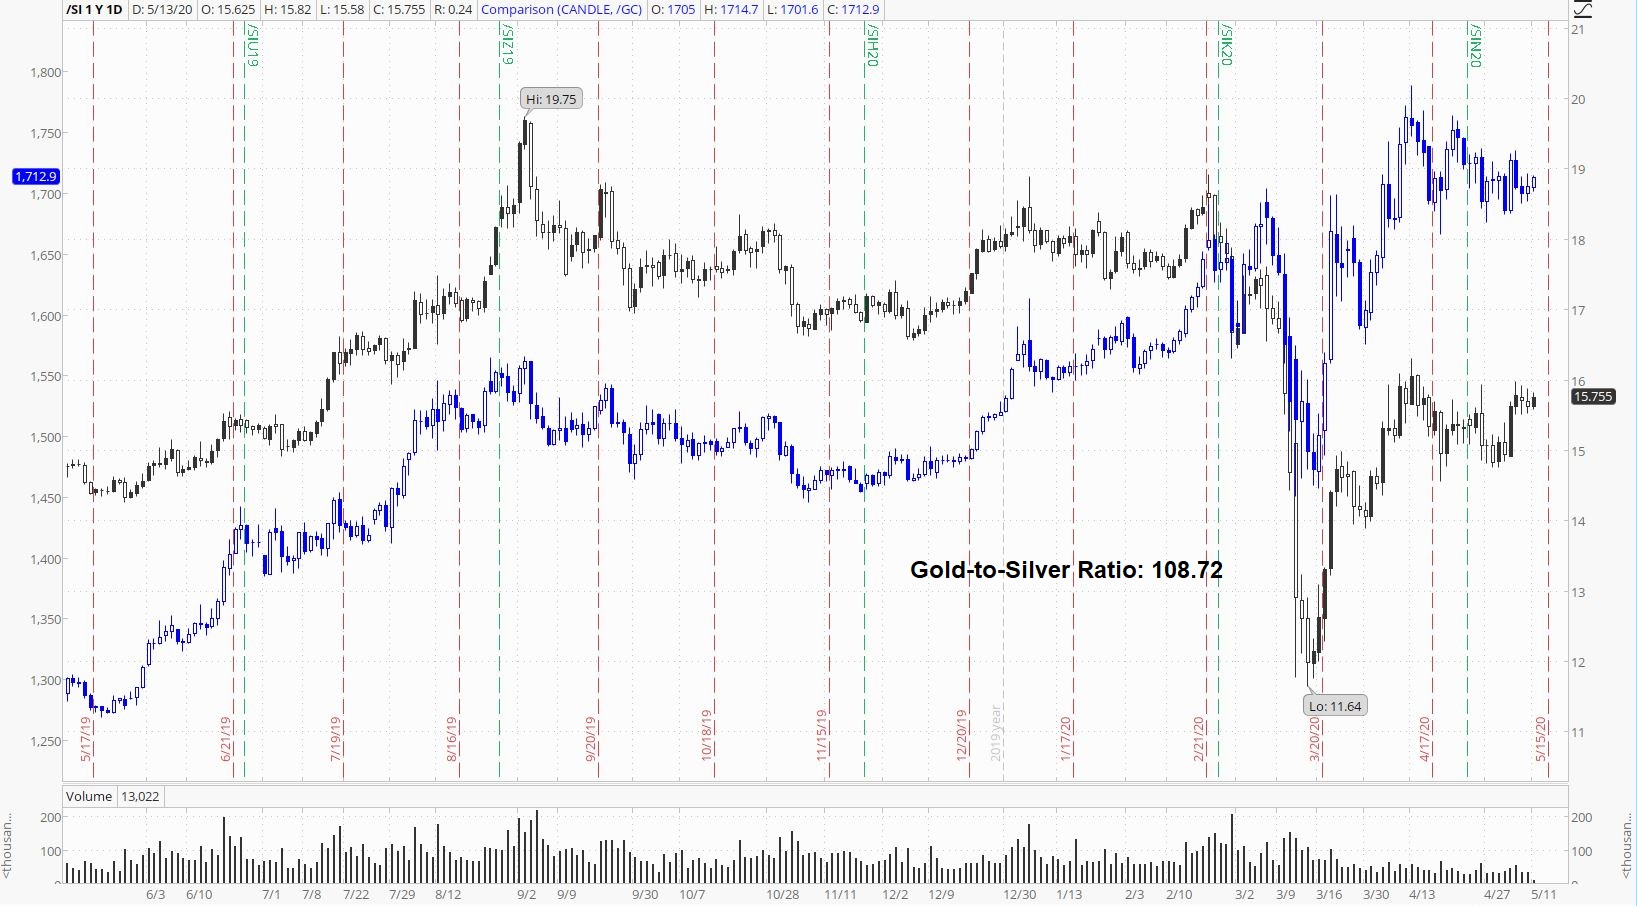
Recall the gold-to-silver ratio has been rangebound between 110 and 115 for several weeks, and for the last several days, the ratio has been under 110 on several occasions.
Silver prices have maintained above its 50-day moving average:
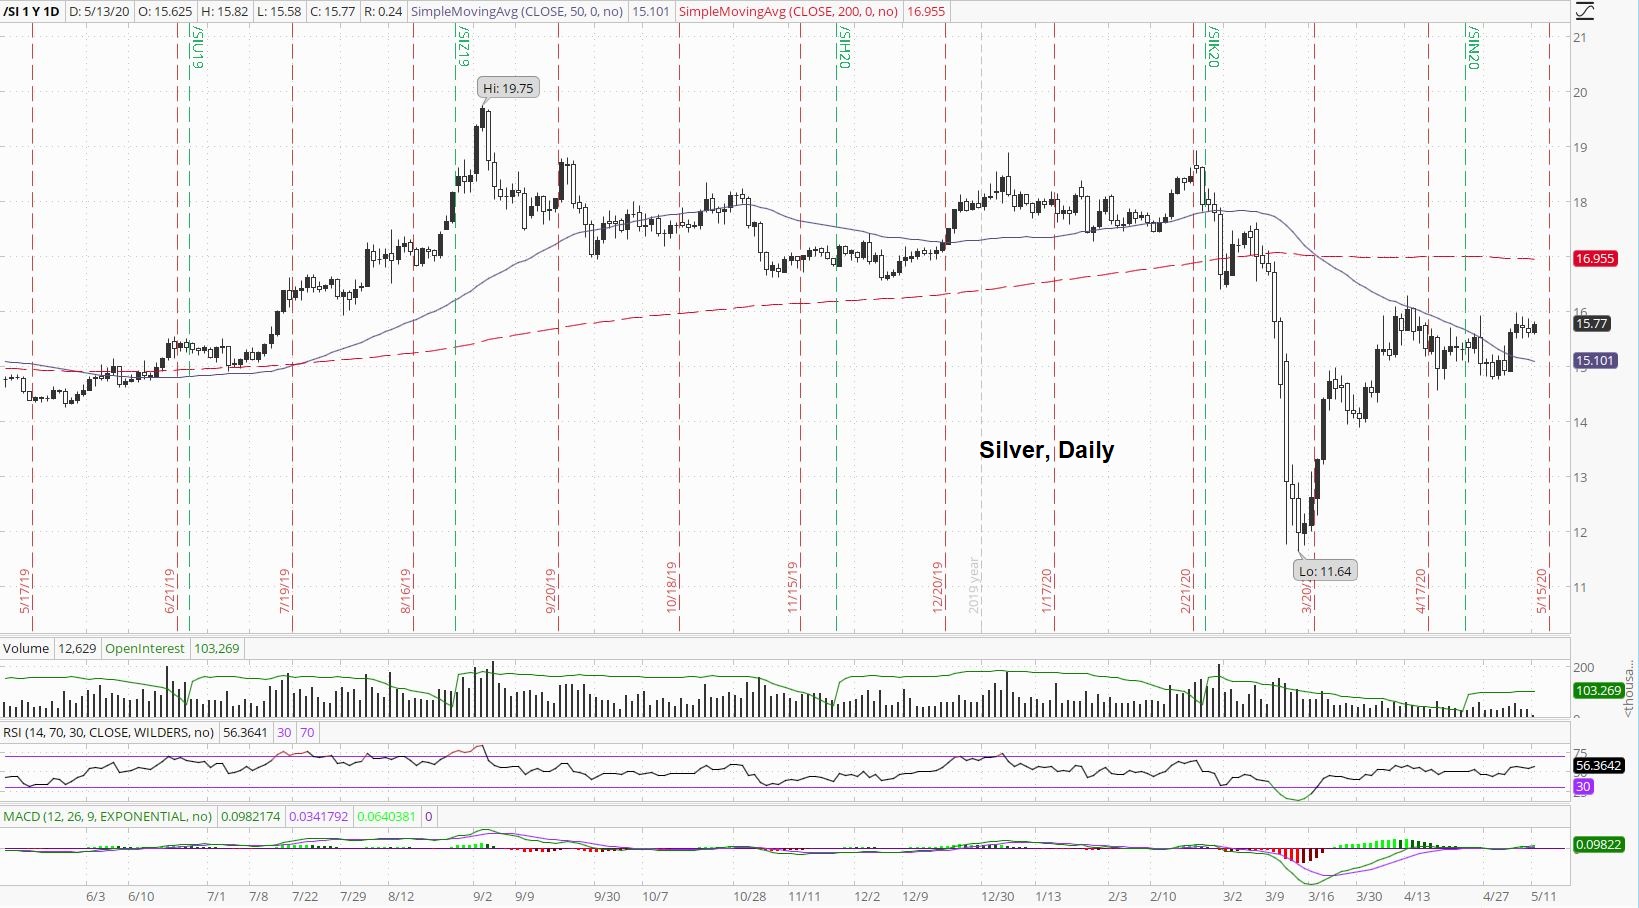
Sometimes simple indicators like, "where is the price in relation to the last fifty days?", can be useful for understanding investor mood and psychology. When it comes to breaking out of a major moving average and staying there for a few days?
Many would say that's bullish!
Gold's daily chart looks amazing:
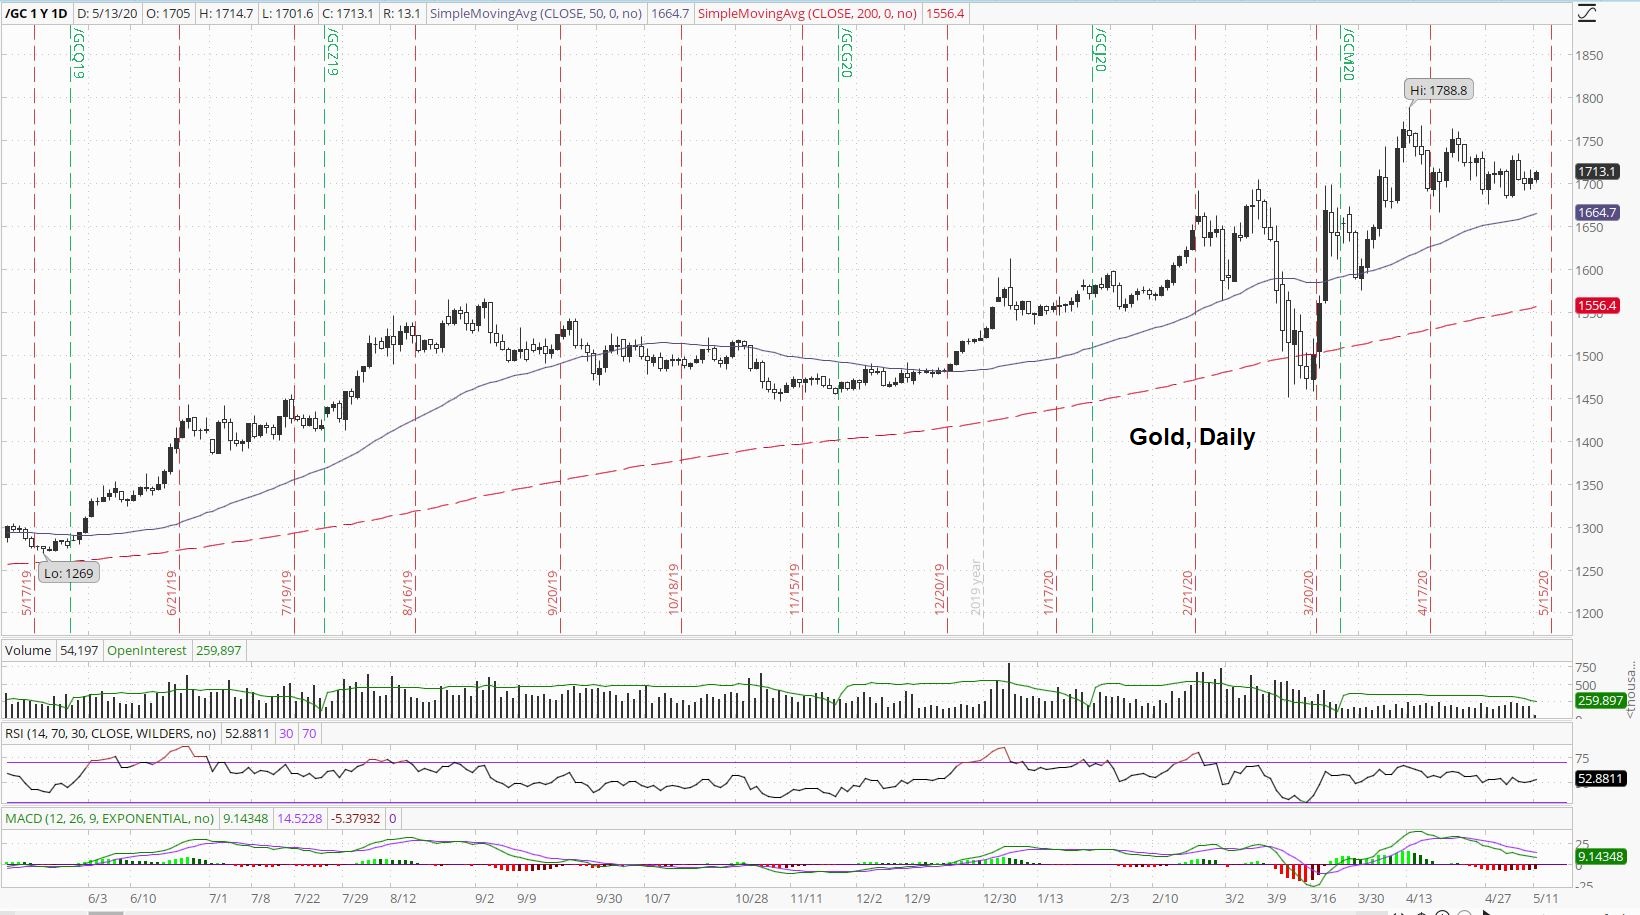
Does anybody else see a bull-wedge if drawn from the late-March low and the mid-April high?
It kind of makes sense palladium is underperforming the other three precious metals:
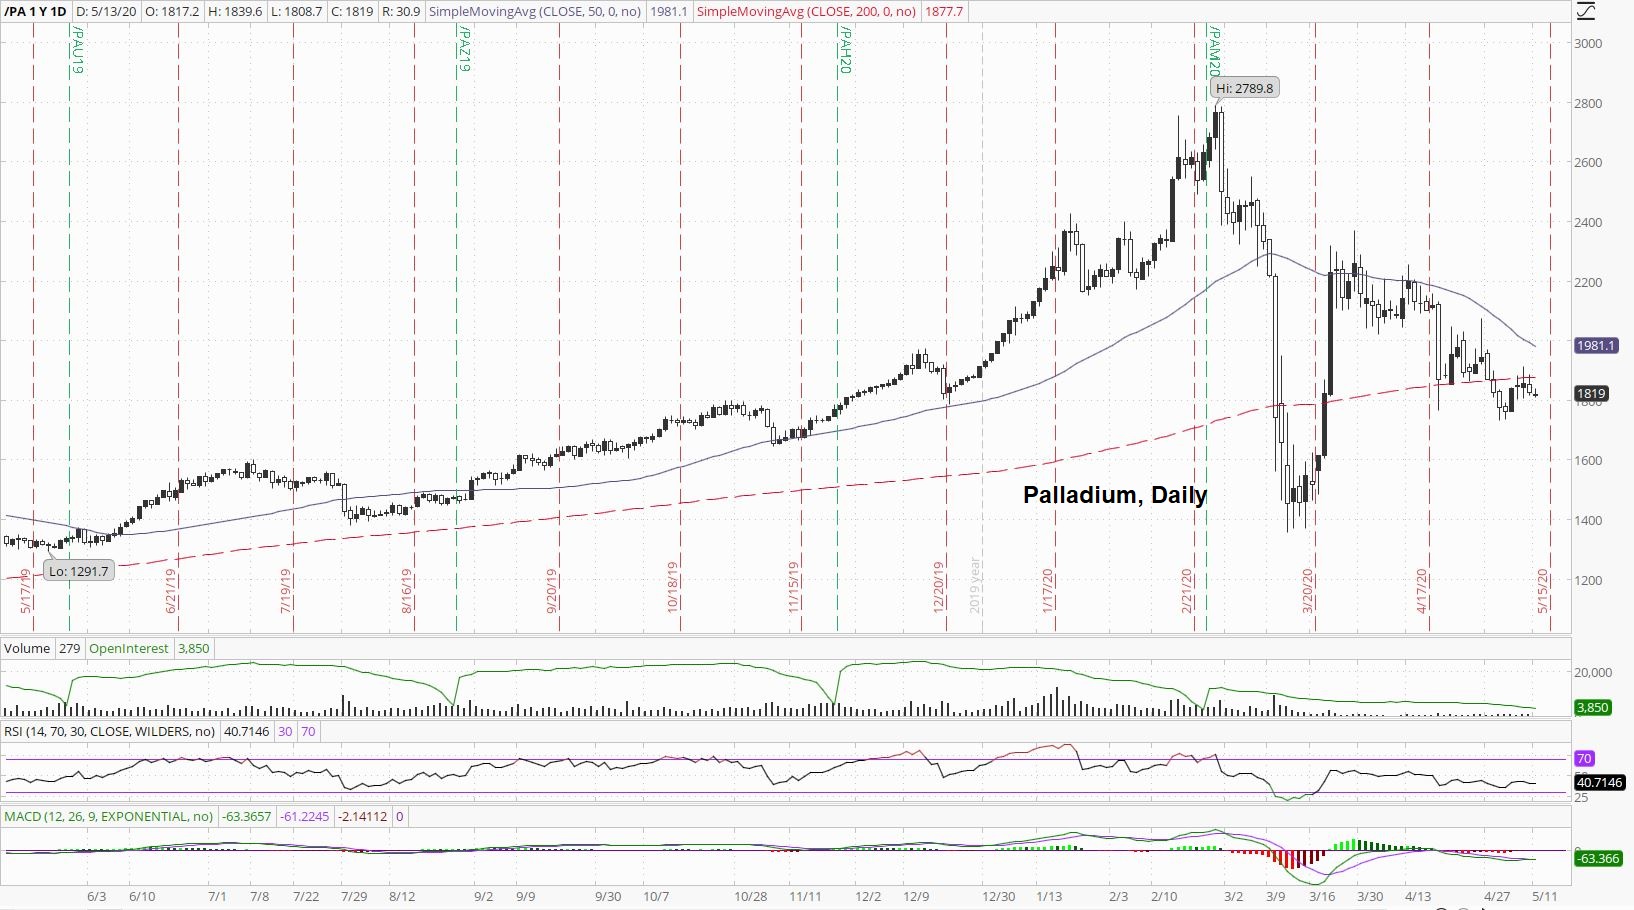
Palladium has been, after all, on a three-year tear.
I'm really liking platinum's set-up:
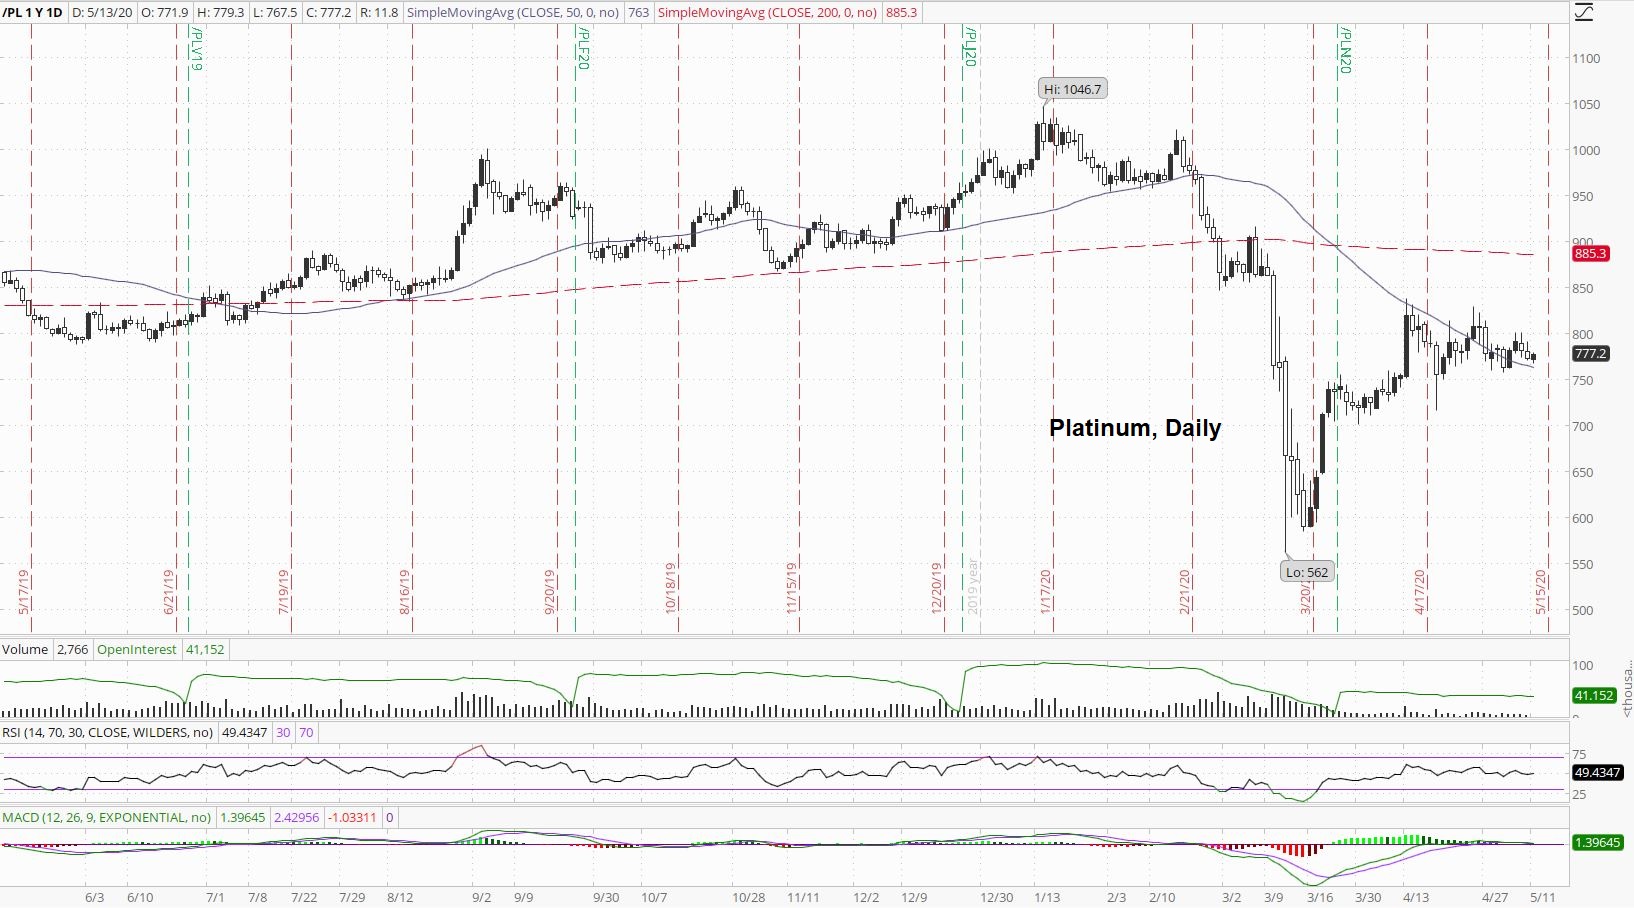
The set-up is similar to silver, and while not quite as bullish of a break-through of its 50-day, the major moving average is holding up as support.
A lot of oil analysts are wondering if we've seen the bottom in crude oil:
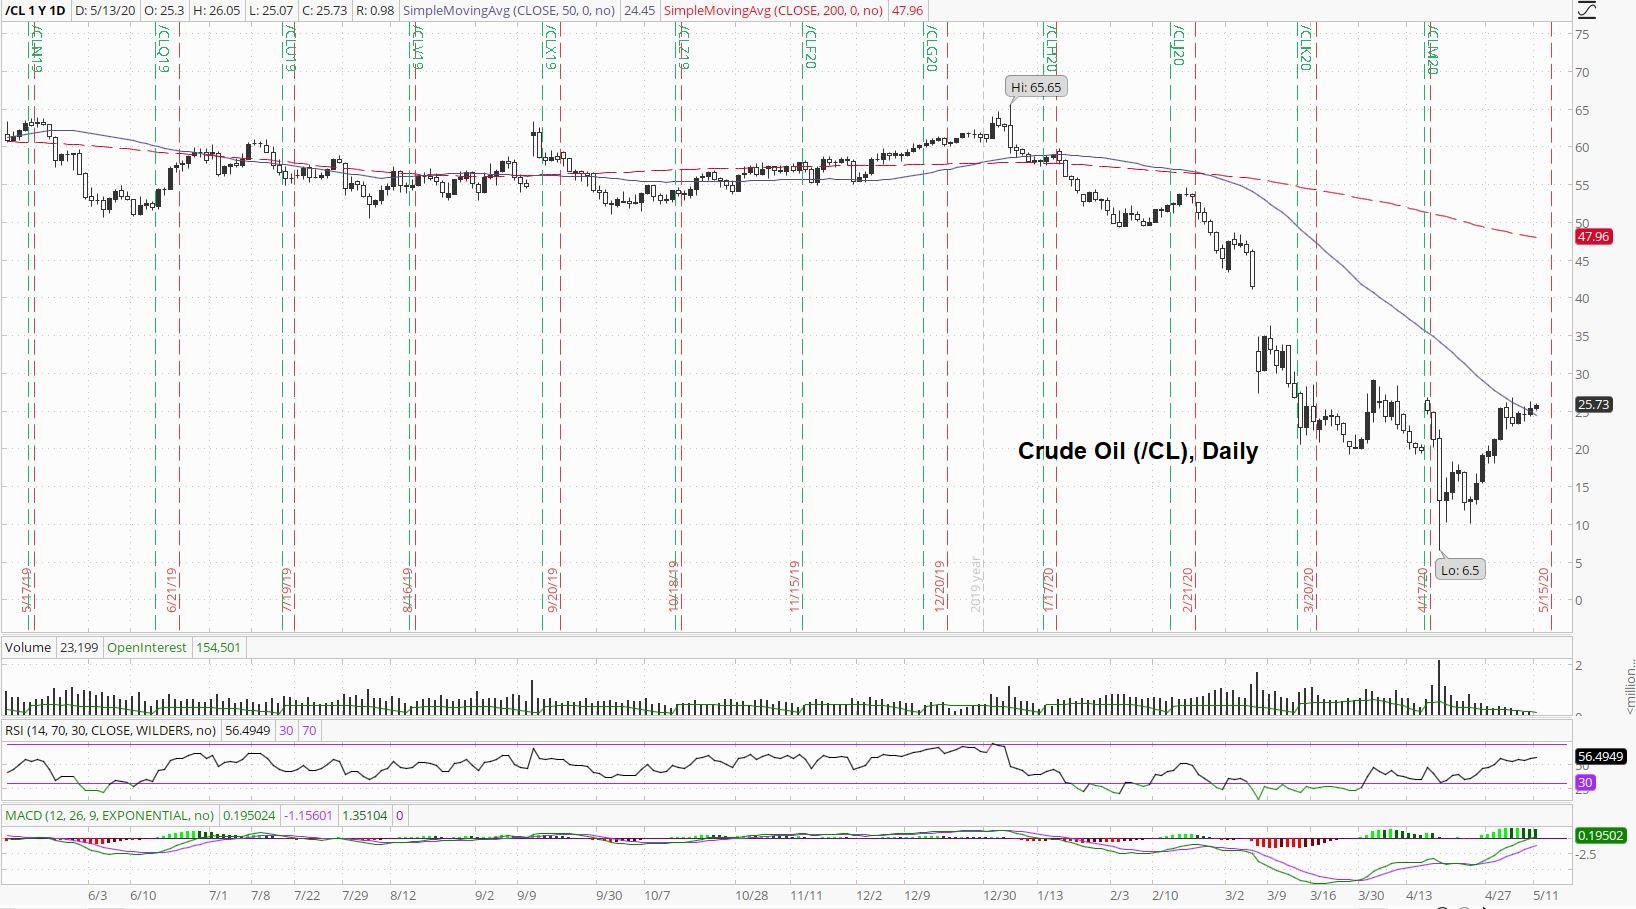
It continues, however, to be a battle between consumption and storage capacity.
Copper, on the other hand, is much easier to store than crude oil:
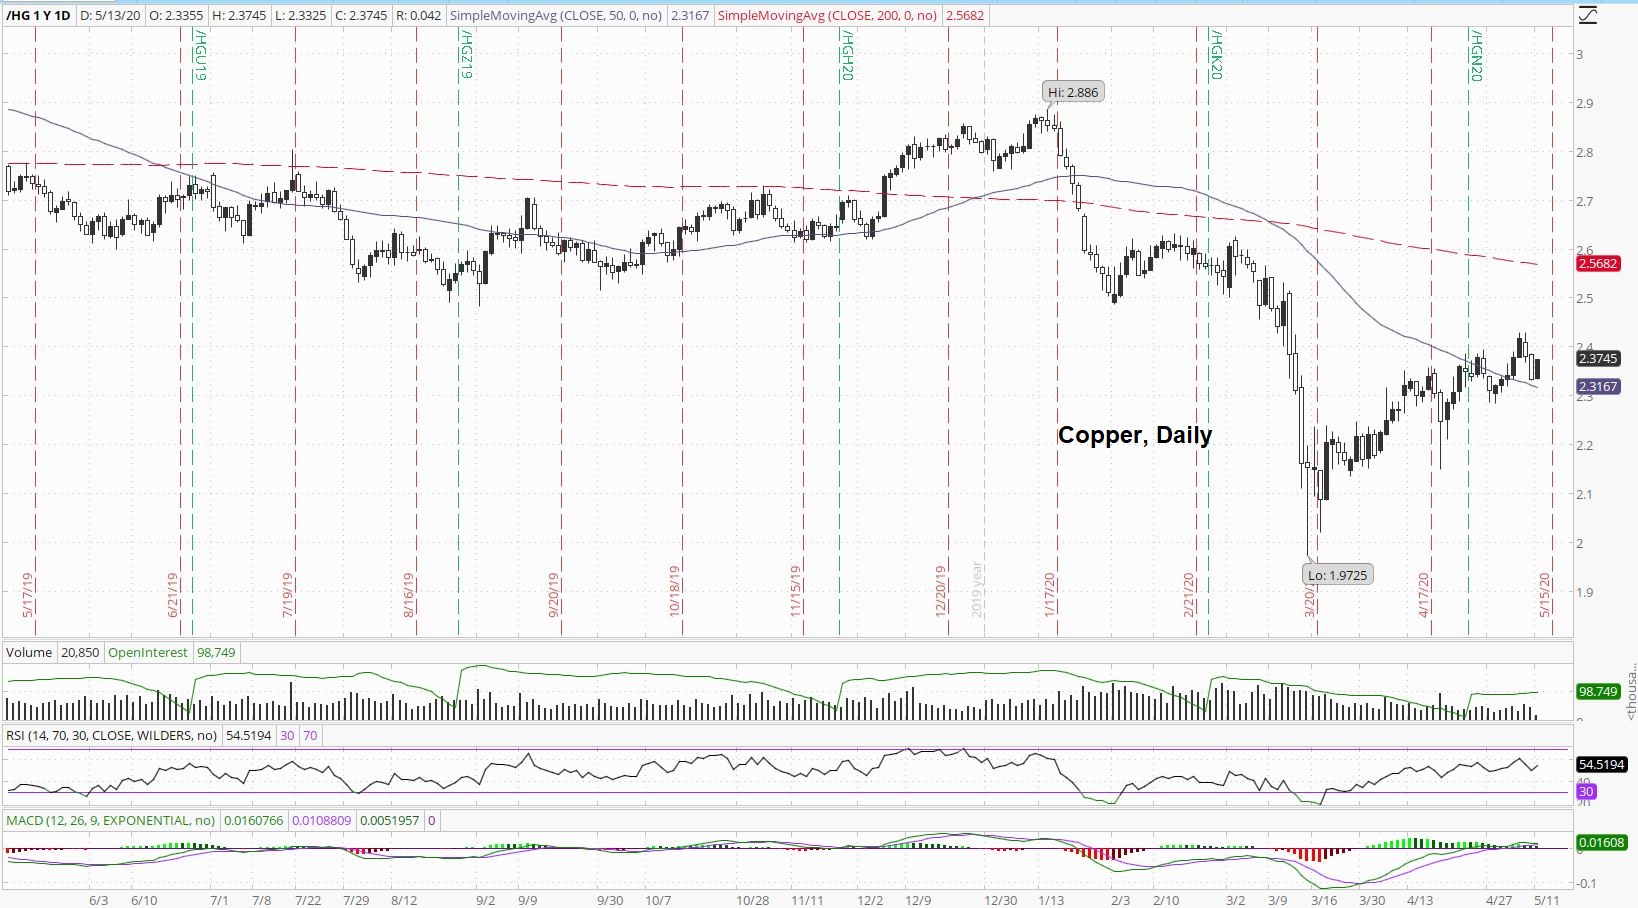
Copper does look to be signaling the era of deflation, if not over, is ending.
The DOW is not sharing the same exuberance as the NASDAQ:
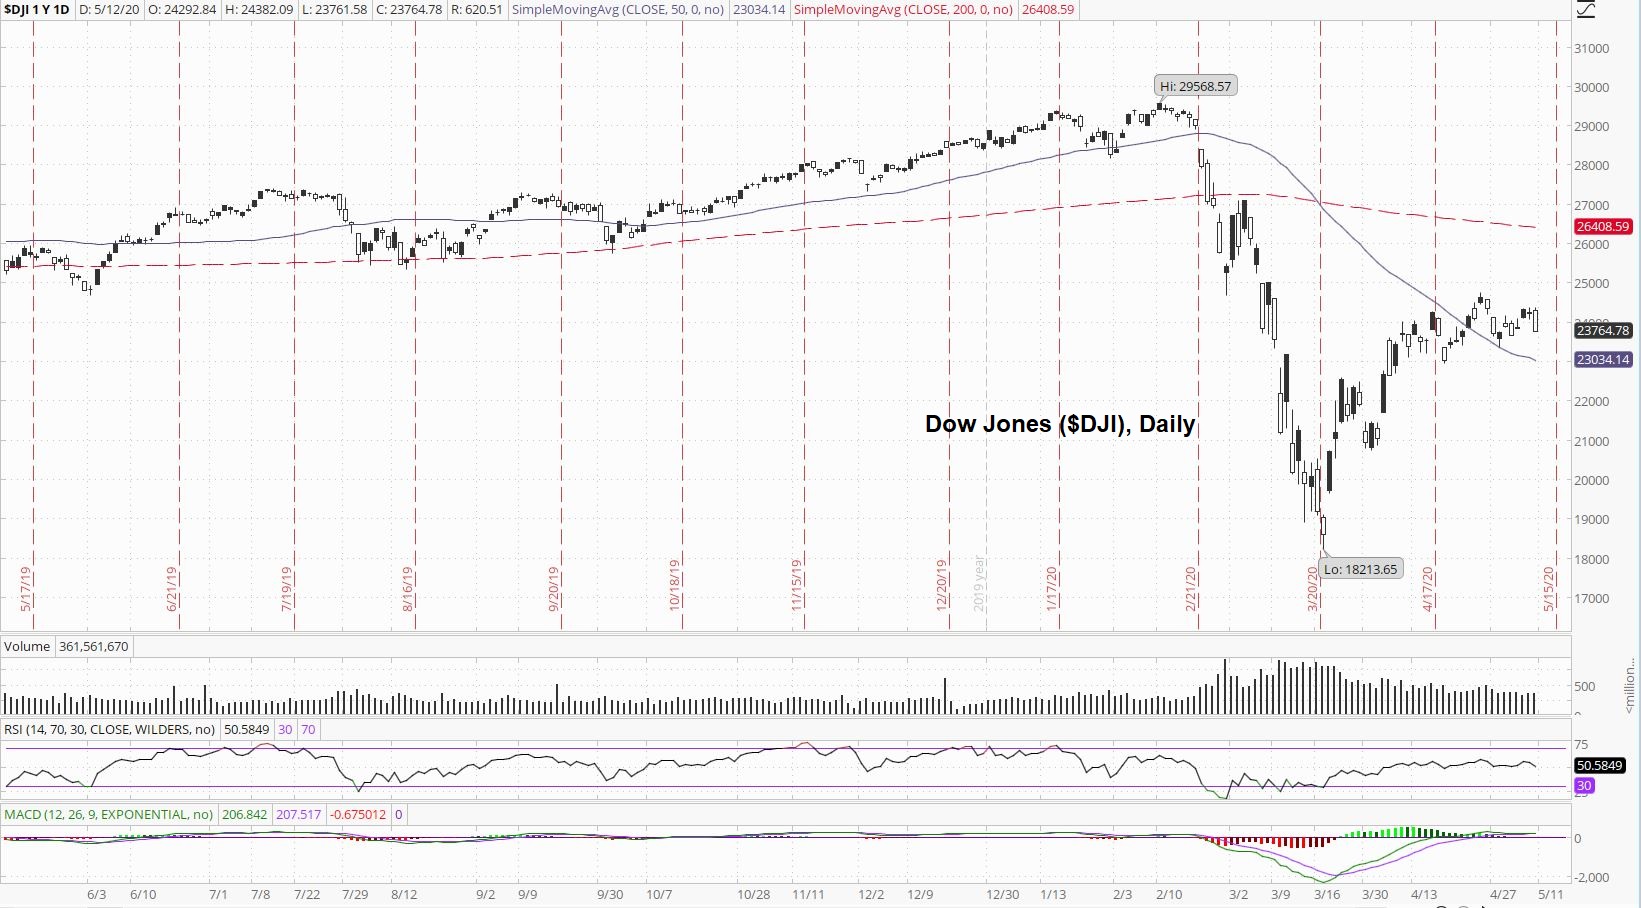
Many traders would say the DOW is not confirming the NASDAQ, and that would be bearish for both (the latter not shown).
If the stock market hasn't seen the bottom, we could get a VIX spike that takes out the previous high:
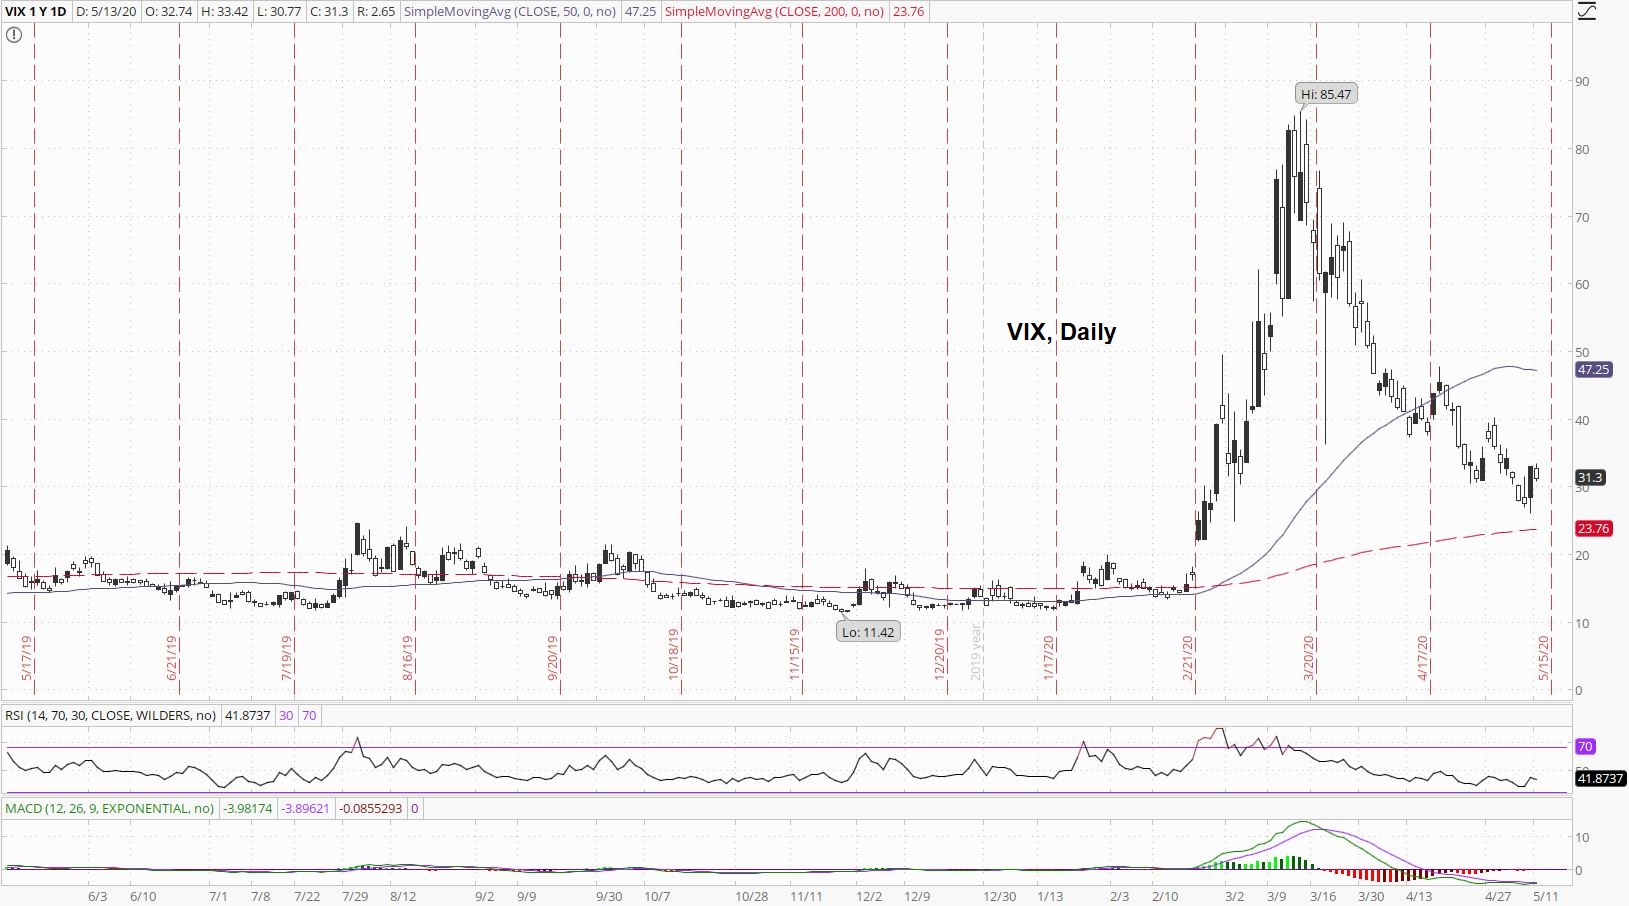
The question is, can the Fed keep the stock market propped-up along with keeping traders and investors complacent?
The US may have spent a record amount of debt in April, but the yield on the 10-Year Note is still pretty much pegged to 0.6%:
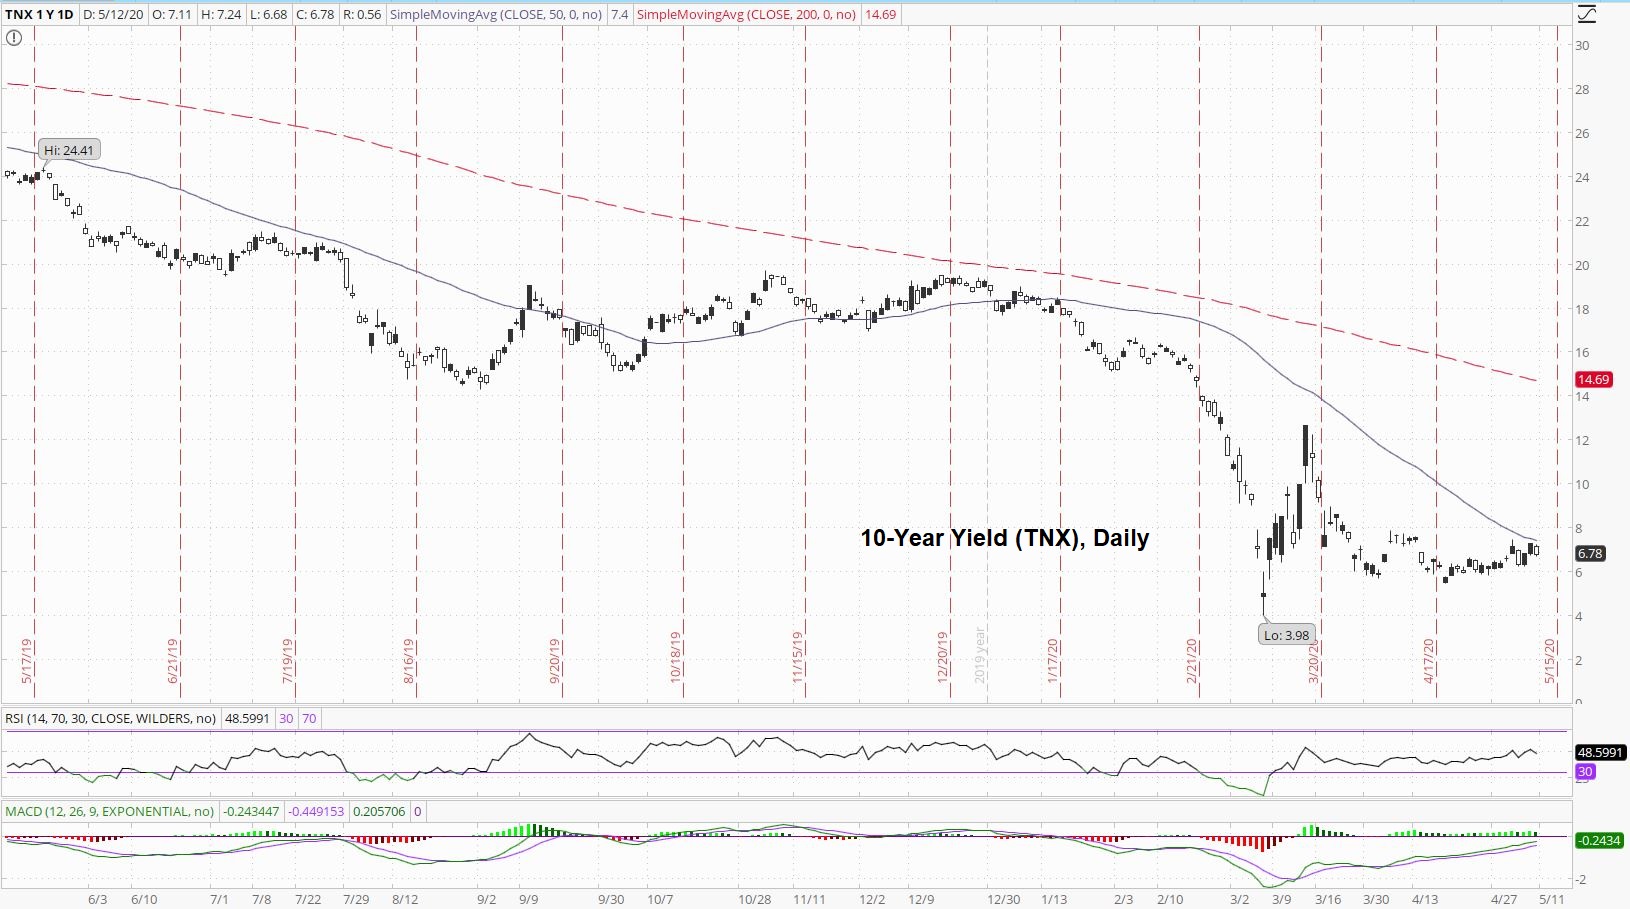
We are getting some wider swings of late, however.
Finally, the US Dollar Index sure seems like it's coiling:
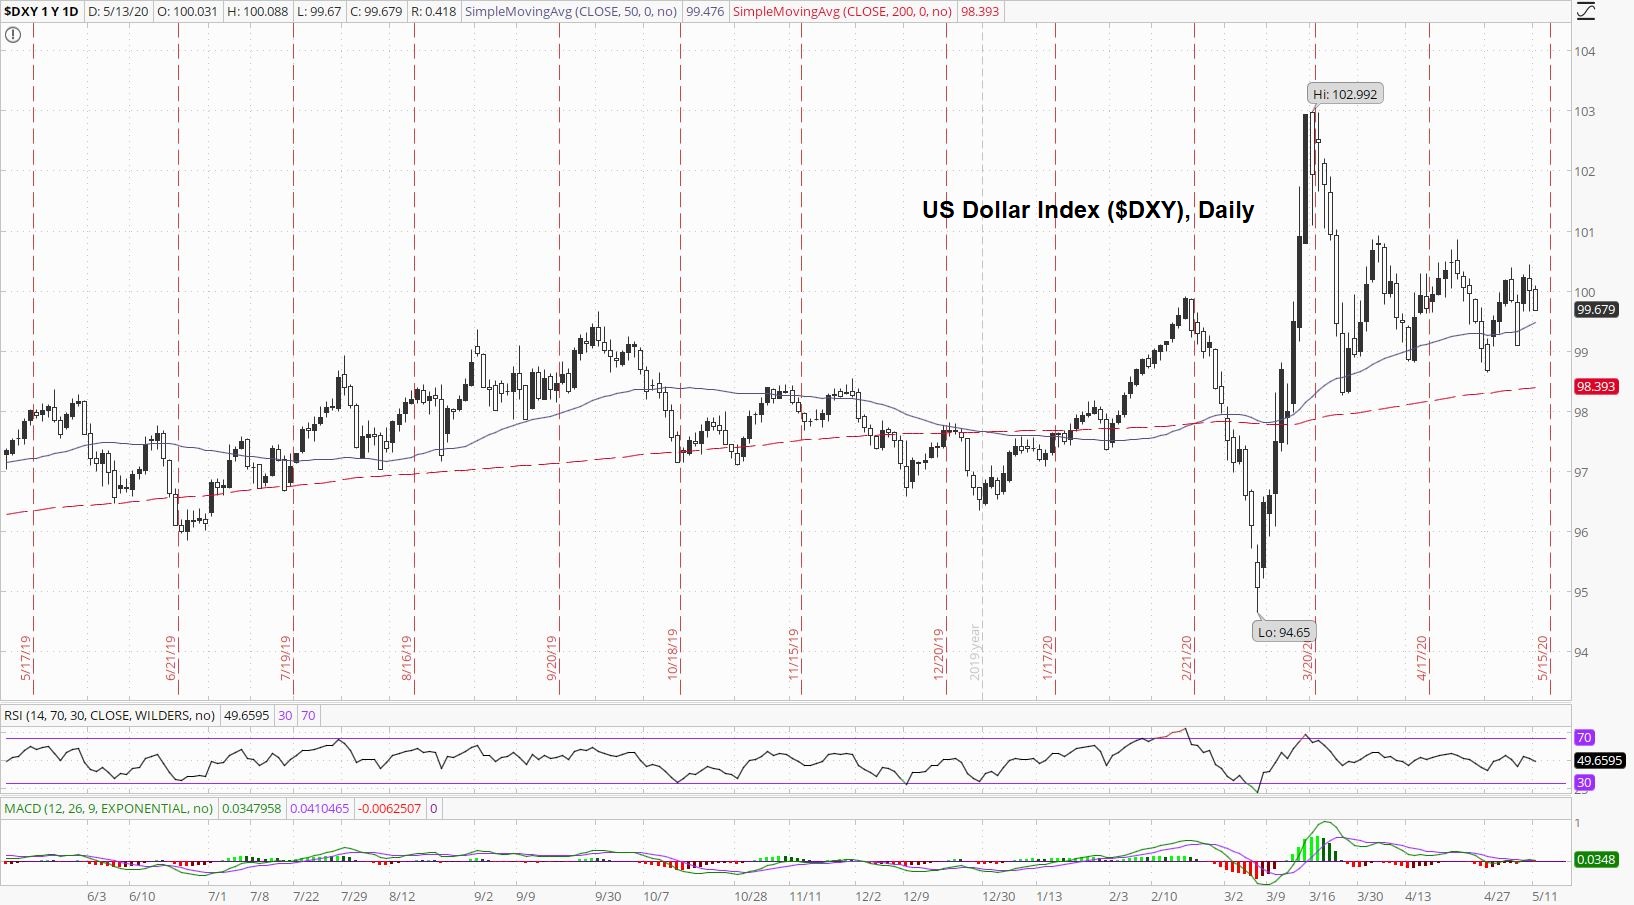
We may get a break-out or a break-down, but no matter which way the dollar moves relative to other unbacked, debt-based fiat currencies, everybody loses when it comes to purchasing power over time.
Thanks for reading,
Paul Eberhart


