

Much has been written about the disconnect between the “paper” gold & silver markets and the “physical” gold & silver markets, whereas the “paper” gold and silver markets are the financialized products offered by Wall Street and the investment banks such as futures contracts, ETFs, ETNs, and the like, and the “physical” gold & silver markets are where buyers and sellers meet to actually buy and sell physical gold and silver, such as the bullion dealers and the miners.
As gold and especially silver fell in price at the end of February, physical gold & silver were bought aggressively, and the disconnect between the paper price and the physical price showed up at bullion dealers all around. The disconnect meant the cost to get physical metal “in-hand” came with a significant premium over the spot price.
Fast forward to this week, and we can now see the disconnect has moved beyond the retail investor.
In fact, just yesterday, James Anderson of SD Bullion reported on a historic spread between spot gold and the futures price:

What are we to make of the disconnect in price between the paper gold & silver markets and the physical gold & silver markets?
Physical gold and physical silver have been in high demand, and they continue to be in high demand. There are a number of reasons why people are buying and investing in physical gold and physical silver right now, but with developments late last week, and with developments which will begin at midnight on Thursday, March 26, let’s focus on one specific reason – supply chain disruptions.
Much has been said about “supply chain disruptions” over the past several months, and if we’re talking about the physical gold market, the supply chain disruptions are affecting all major points of production.
Here’s a quick sampling of the various supply chain disruptions in the physical gold market:
-
Mines (gold, platinum, etc) in South Africa will shut down at midnight this Thursday as part of South Africa’s actions for coronavirus mitigation (https://www.bloomberg.com/news/articles/2020-03-23/south-africa-orders-mines-to-close-in-21-day-virus-lockdown ).
-
Some large gold refiners in Switzerland had already shutdown as part of thieir nation's coronavirus mitigation (https://sdbullion.com/blog/gold-bullion-shortage-scramble-sends-comex-premium-to-45-year-high ).
-
The Royal Canadian Mint has suspended production for two weeks as part of Canada’s measures against the coronavirus (http://gata.org/node/19969 ).
Using just the three examples above, not only do we see that there are indeed supply chain disruptions in the gold sector from the point where gold's taken out of the ground to the point where gold is for sale to a buyer, but the supply chain disruptions are global in nature, with the three examples above taking place in Africa, Europe and North America respectively.
That said, investors who want one ounce or more of physical silver in-hand are paying much more than $14.50:

Is silver attempting a “V” shaped recovery?
Gold sure looks like it’s made a “V” shaped recovery:

It will be interesting to see if gold consolidates around $1,650.
The gold-to-silver ratio has pulled-back from the epic, historic high:

The “paper” ratio is just under 115, although James Anderson has also reported (http://www.gata.org/node/19963 ) on the disconnect between the “paper” gold-to-silver ratio and the “real” gold-to-silver ratio when looking at an actual marketplace where buyers and sellers buy and sell physical gold and physical silver.
Palladium is fighting for $1900 on Wednesday morning:
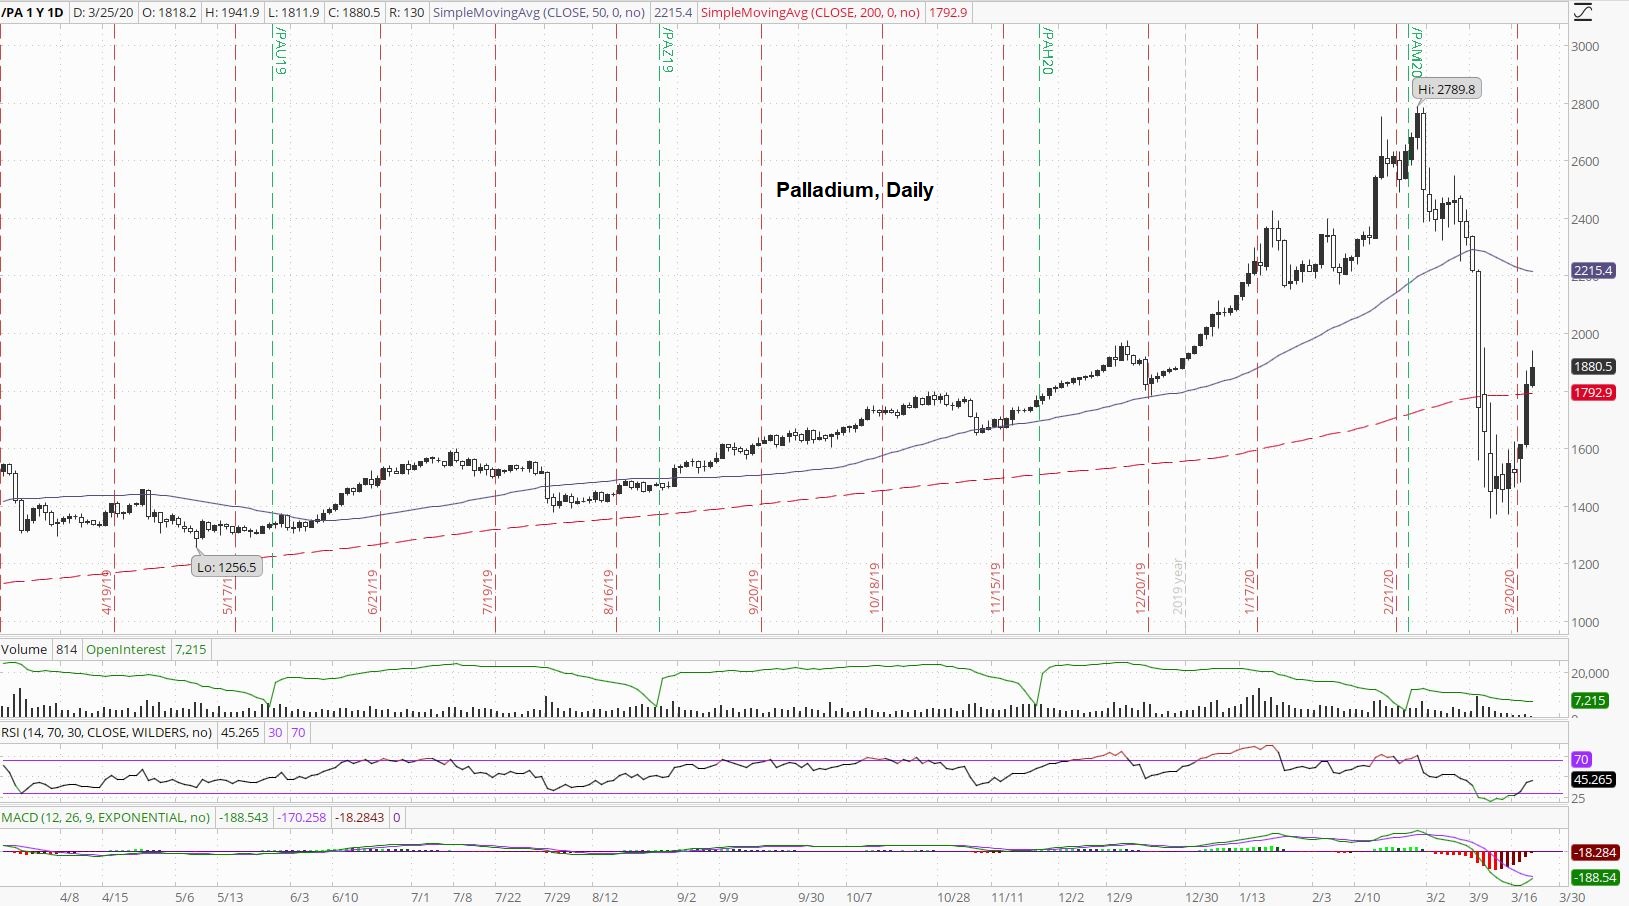
Palladium is back above its 200-day moving average.
Platinum is back above $700 after spending several days below $600:

Will the bearish crossover of the 50-day moving average against the 200-day moving average be negated by a “V” shaped recovery with platinum?
Crude oil has fallen into the low $20s:
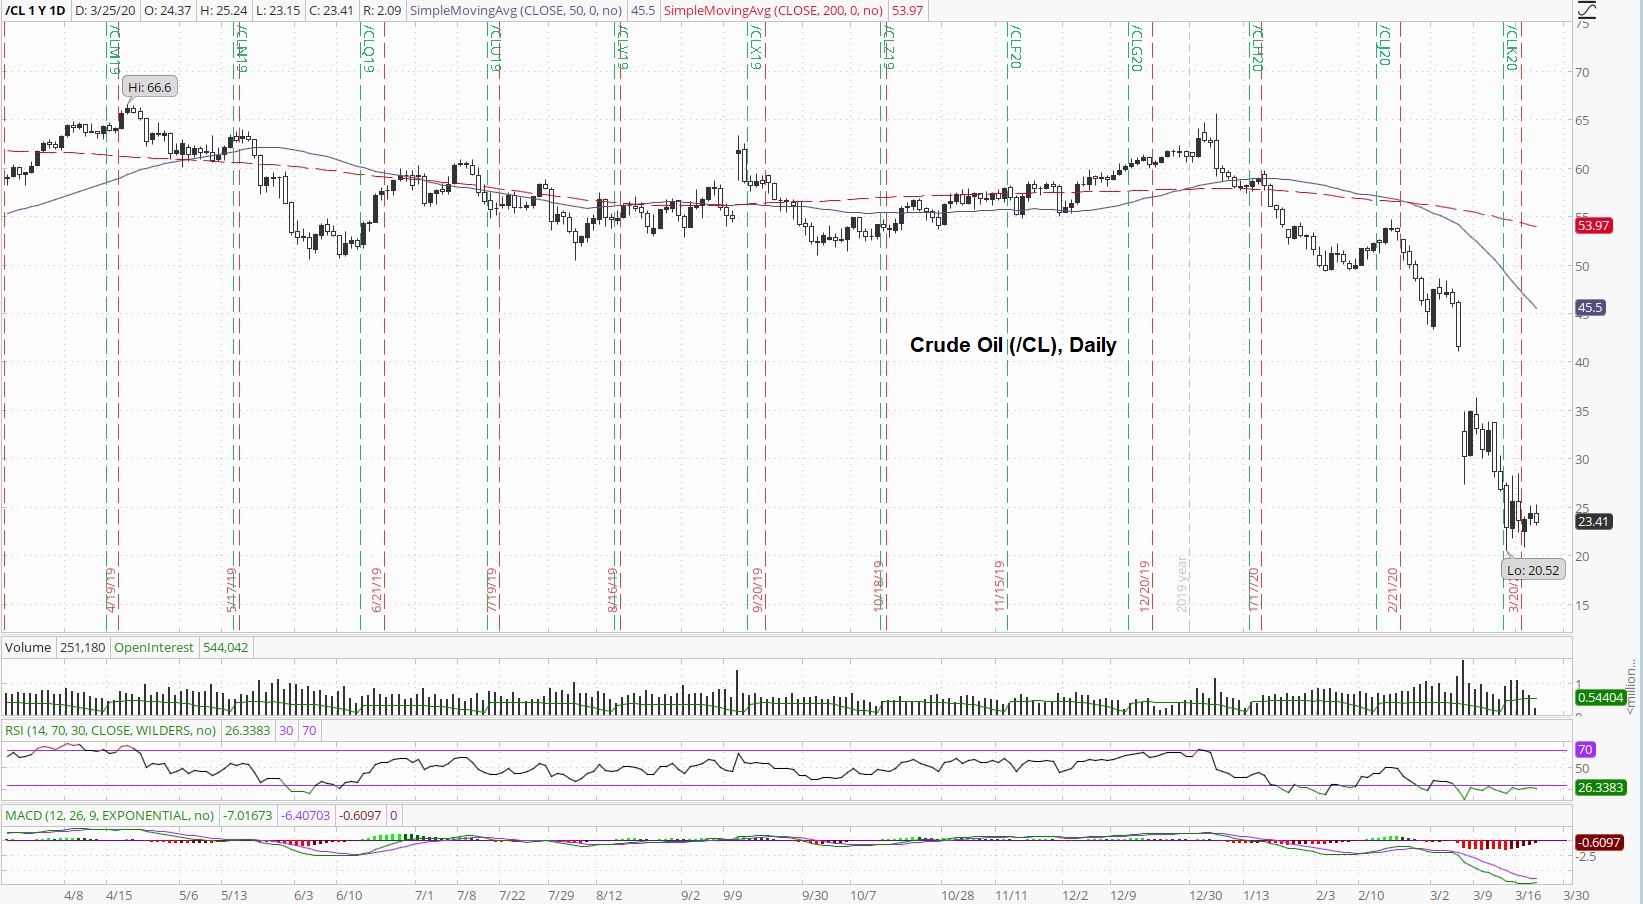
It will be interesting to see if there is a floor in the price of crude oil as President Trump, just a few weeks ago, ordered the refilling of the nation’s Strategic Petroleum Reserve.
Copper is banging around $2.10 and $2.20 right now:

If copper stabilizes here, could that be advance notice of the broader economy somewhat stabilizing?
Looking around at the more trader-centric financial websites, there’s chatter about “shorting volatility” again:

The assumption is that governments and central banks will be able to intervene and successfully stabilize the financial markets, which means calming down volatility in the markets.
The Dow Jones had a record-breaking one-day surge yesterday:

The is much debate as to whether this is a bear market rally, or if the interventions into the markets actually move the markets to new all-time highs and beyond.
One thing that’s been very volatile lately has been yield on the 10-Year Note:

Since the very end of February, yield crashed to 0.39%, moved back up to 1.2%, and has since fallen back down under 0.8%.
There has been much speculation about a move to de-value the dollar:

For now, however, the US dollar index is above 101.70 after going on such a massive tear.
Thanks for reading,
Paul Eberhart


