This week, we speak with Christopher Aaron of iGoldAdvisor.com on major macro trends for gold, silver, and the major financial markets to close this year into 2019.
Last time Chris was on his show in early June 2018, we discussed the then building probability that spot prices could fall as they indeed did throughout this past summer 2018.
What major trends is Chris watching at the moment?
What is happening with the Gold Silver ratio, bond market, and how useful is the COT Report for making short term trading calls?
Both gold prices and silver prices traded sideways to slightly up this week. Gold looks to be closing just under $1,230 dollars per ounce, while silver spot price in US dollar terms is closing around $14.70 a troy ounce.
With us this week, a gentleman who we last spoke with last in early June of 2018. Chris was prescient in identifying in advance the recent downtrend in silver and gold prices this summer 2018.
He is Christopher Aaron of iGoldAdvisor.com and our most recent gold and silver related discussion with him is in the video posted above.
Topics discussed incude:
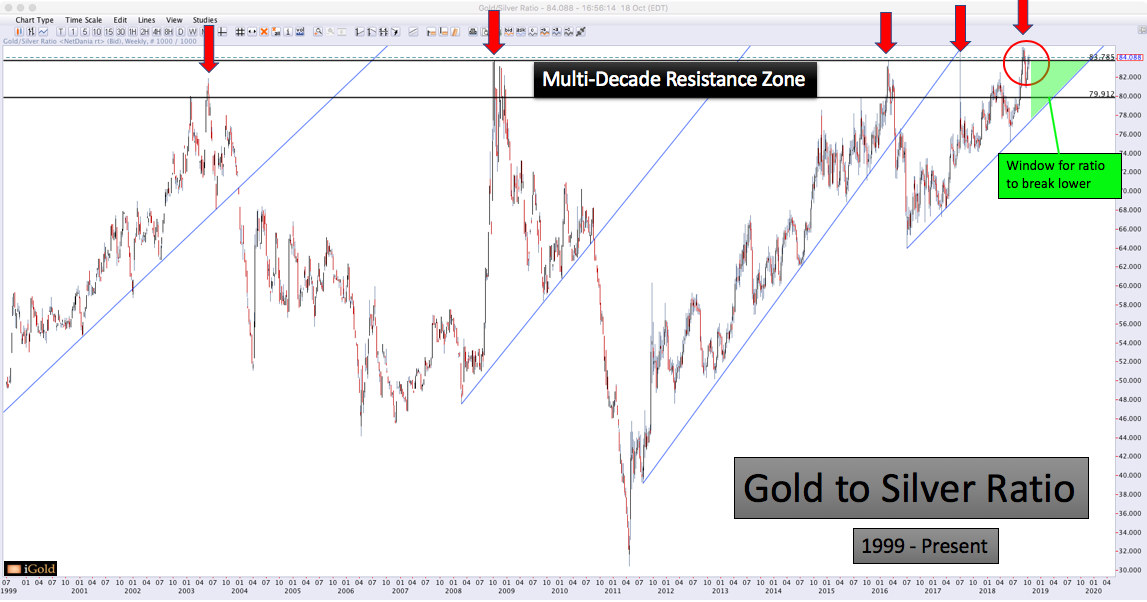
- Gold Silver Ratio multi decade range
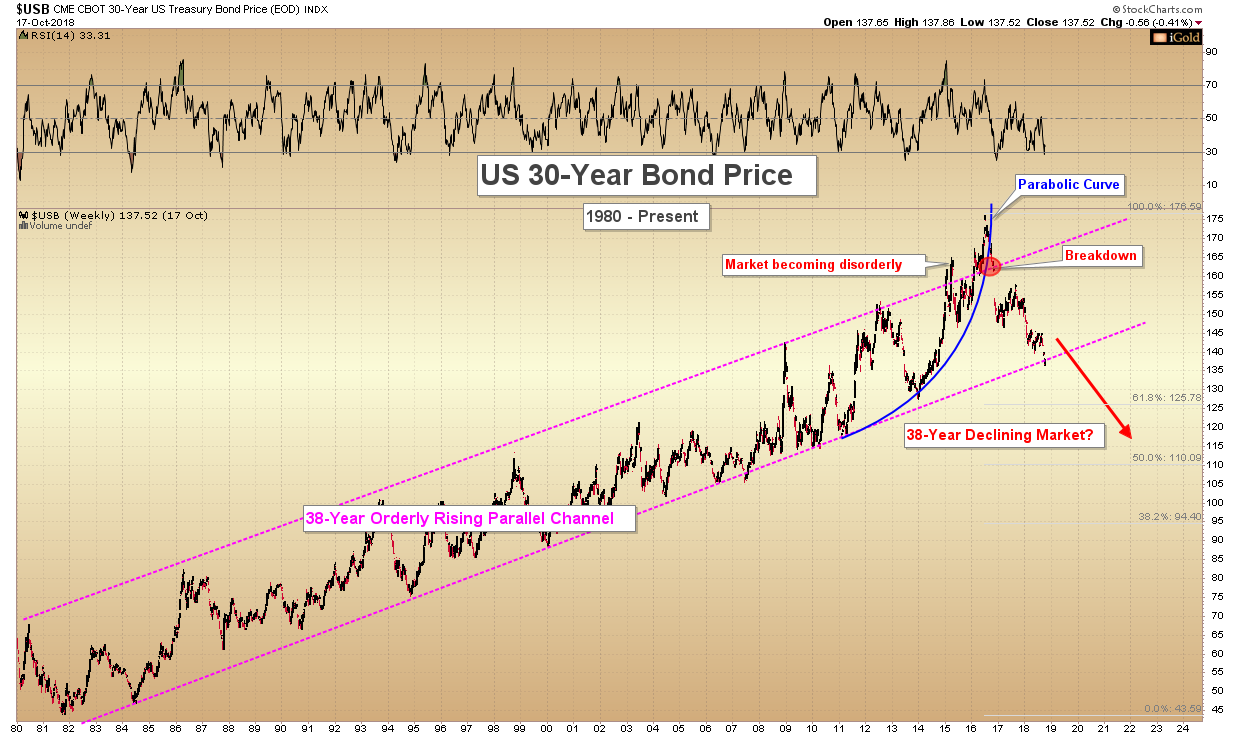
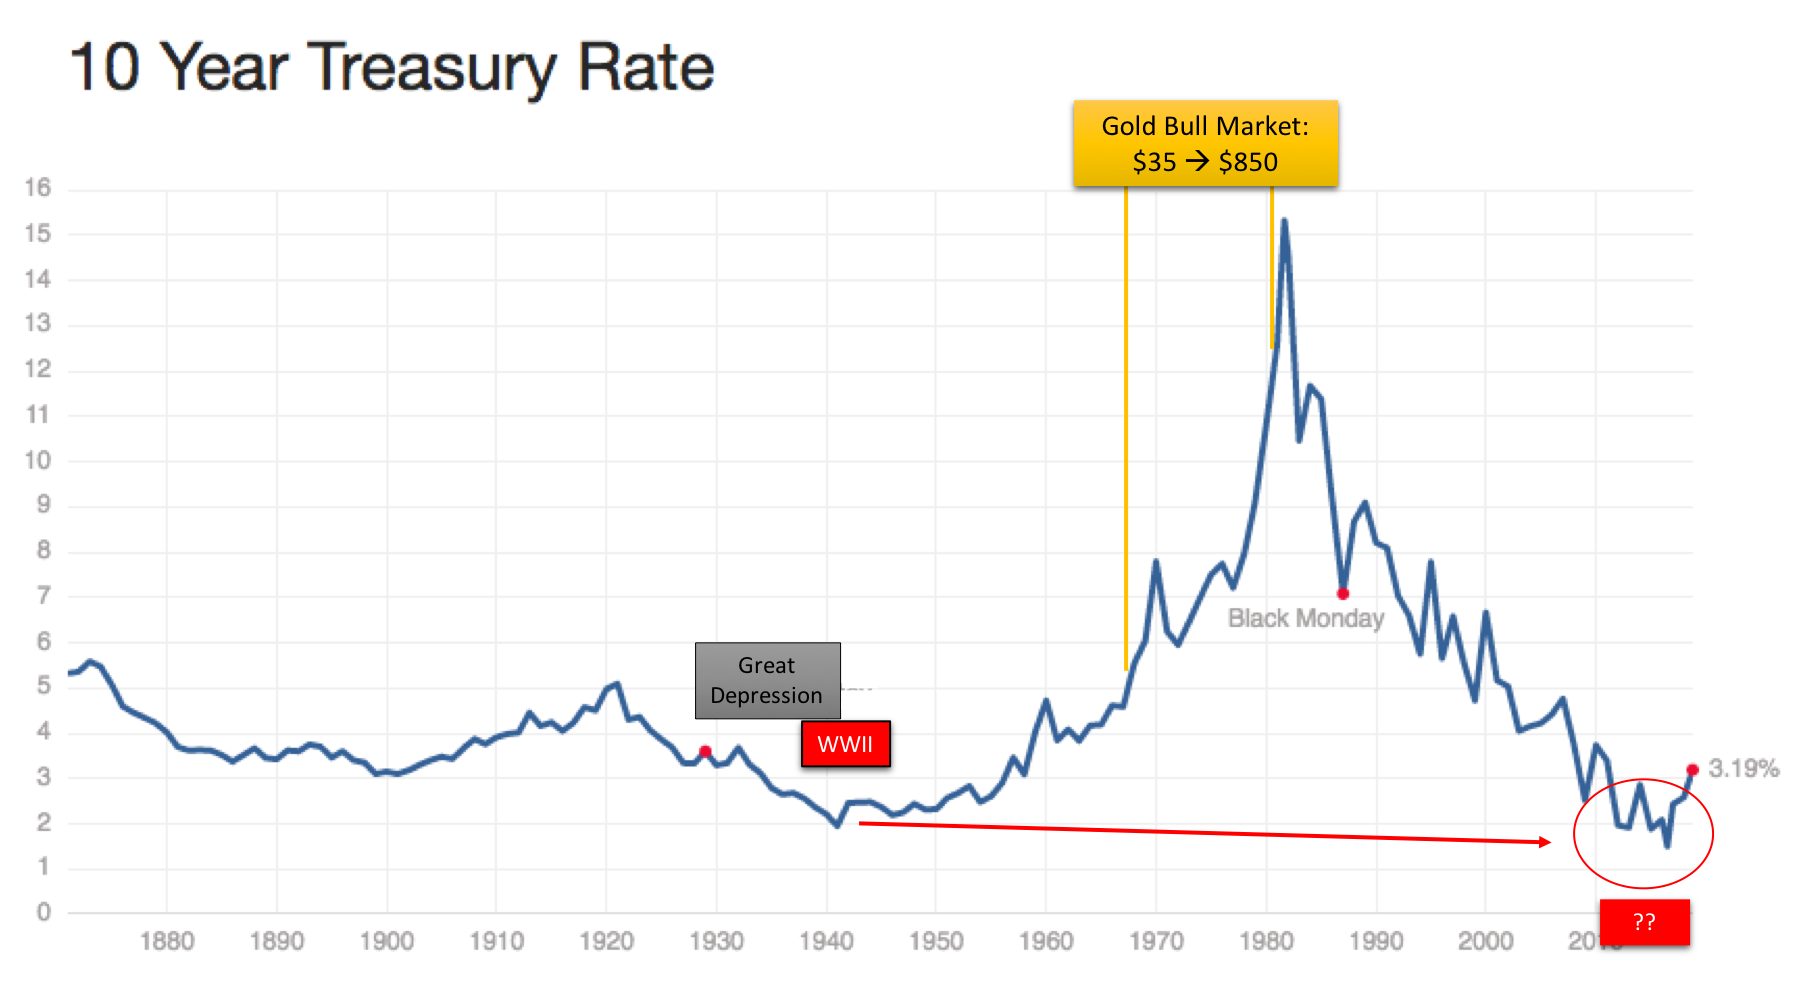
- US Bond Bear Market potential almost 40 years later
- What could happen with US stocks in the coming years
- Gold COT Reports and their historic usefulness for timing trade trends
Charts used in the video discussion include the following:
Gold Silver Ratio: Multi-Decade Resistance Zone
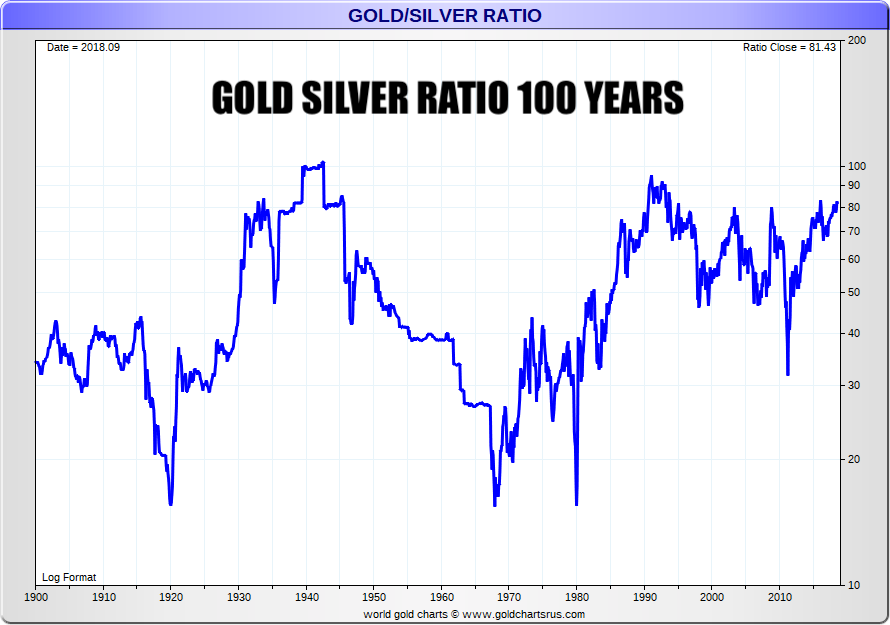
Gold Silver Ratio: 100 Year Chart
US 30 Yr Bond Price Chart: 1980 to 2018
US 10 Year Treasury Rate: 1870 - 2018
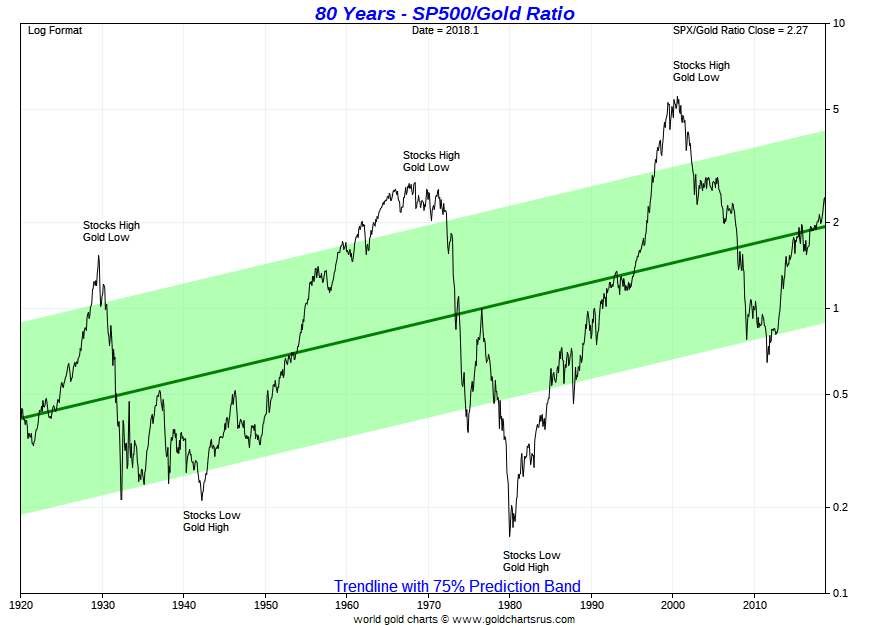
Gold S&P 500 Chart: 80 Years
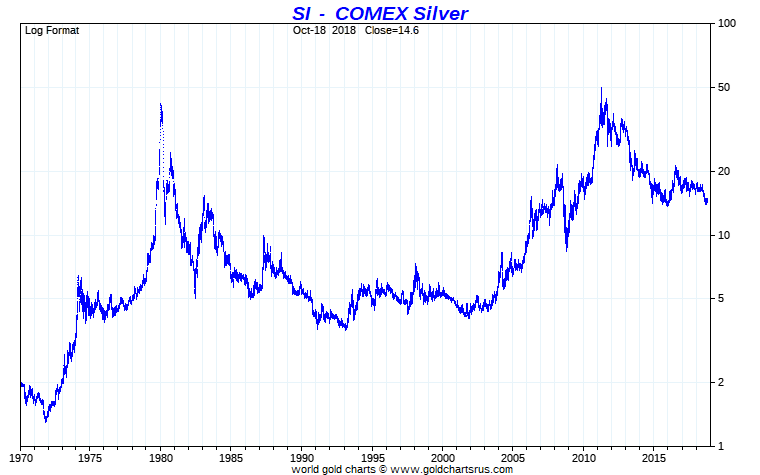
Silver Price in Full Fiat US dollar era
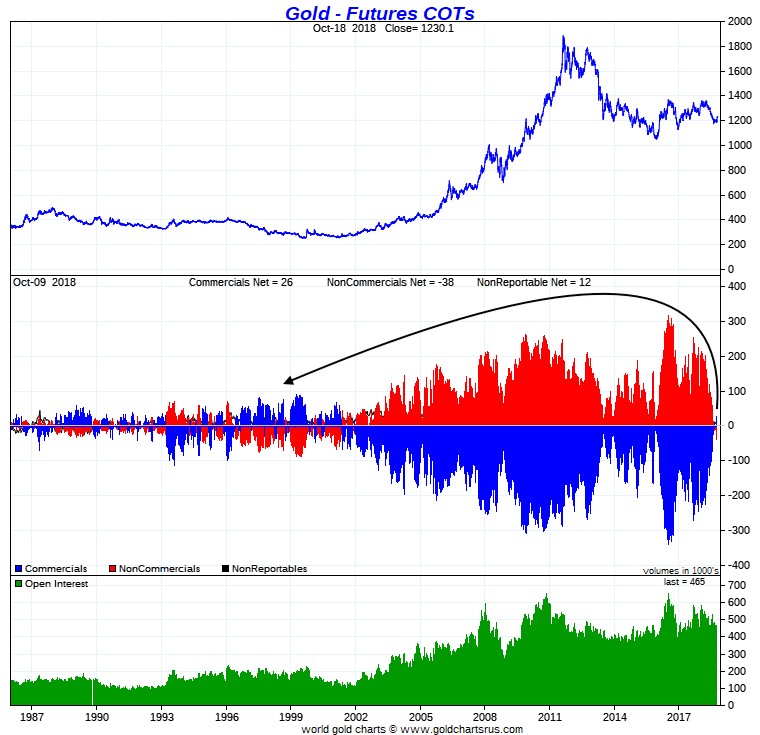
Gold COT Market Chart: Lack of Correlation Between Price and Commercial vs Speculative Class
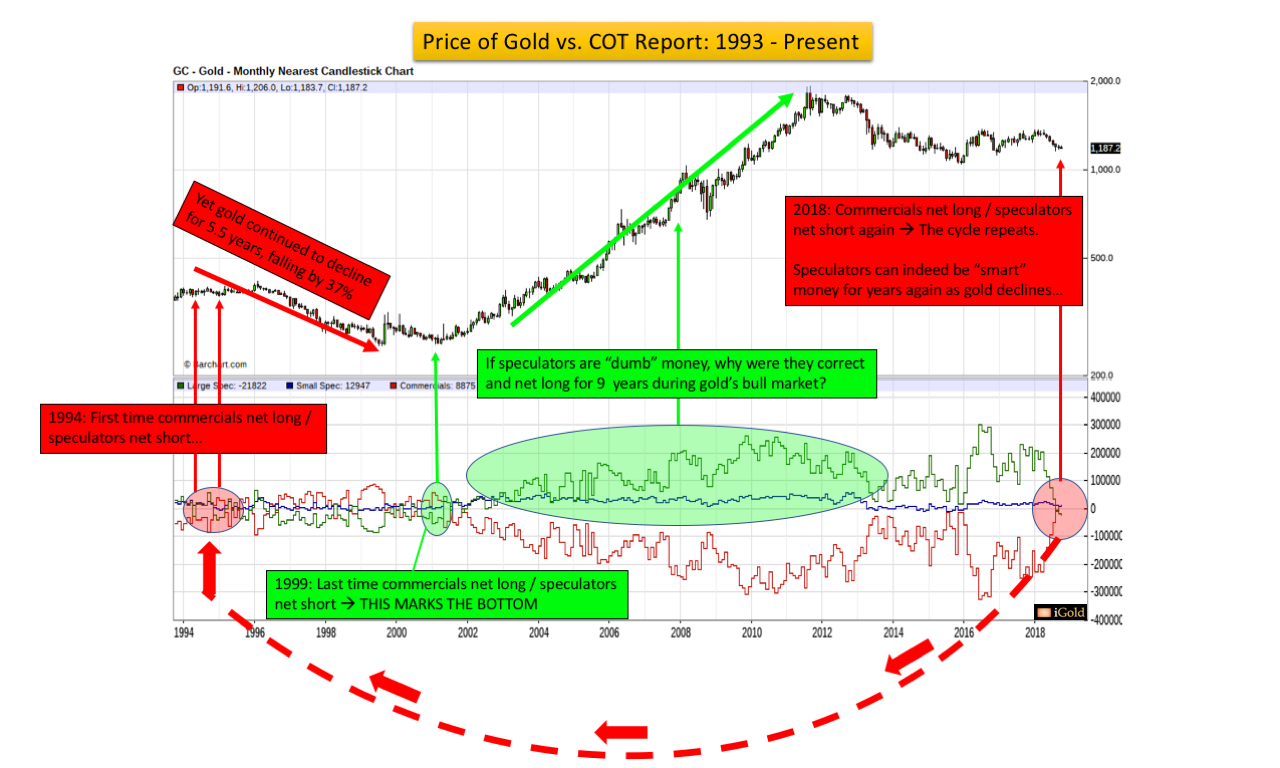
Gold COT Market Chart 1986 - 2018
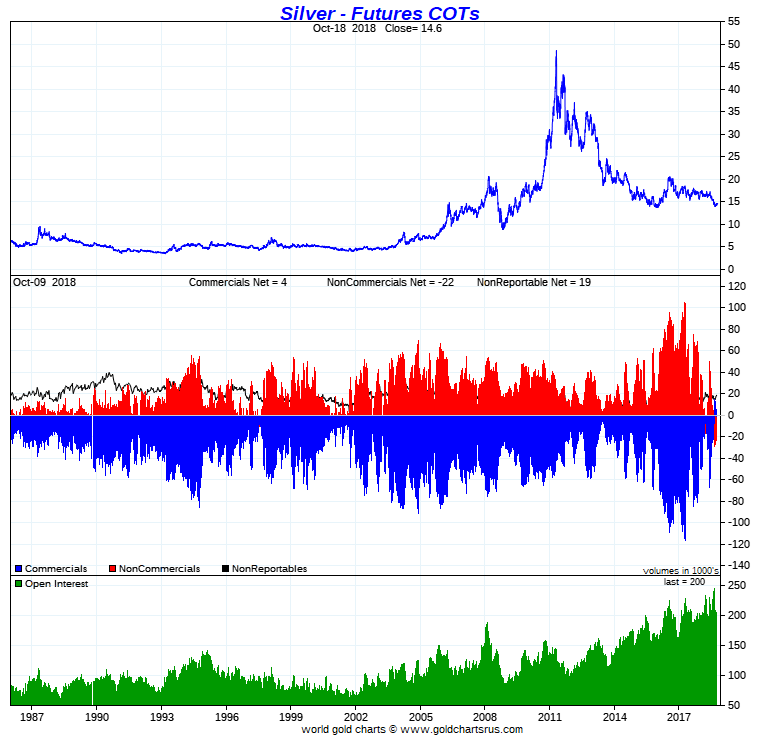
Silver COT Market Chart: this is the 1st time in +20 years Commercials are net long
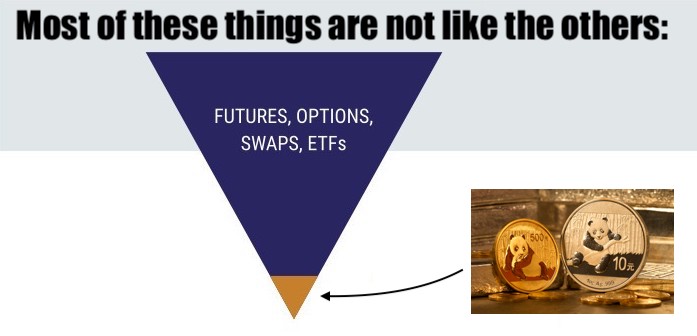
In this Full Fiat Currency Era, Precious Metal Markets have become Over Leveraged
***