
Progress was being made in international trade.
The keyword there is "was" because 2020 happened, and so did Black Swan after Black Swan.
Now, halfway through 2020, It seems the Trade War with China is heating up again. Indeed, many analysts are wondering if trade talks or trade itself is breaking down. Two days ago it got the point where President Trump even put out a late-night Tweet about China and Trade.
Specifically, this Tweet:
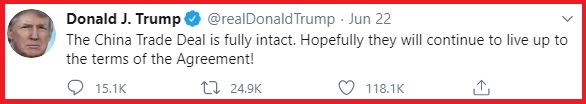
The trade deal may be fully intact, but consider the following: The Phase One Trade Deal agreed upon in January is basically non-binding, and is more of like a memorandum of understanding than an outright brand new trade contract between nations, but what matters is not necessarily what the trade deal was, but rather, how circumstances have changed since the beginning of the year when the trade deal was signed.
That is to say, we've seen travel bans between nations, which, to this day, are not fully sorted out, we've seen global supply chain disruptions and a collapse in global trade, and we have seen the two nations both contending with major social issues.
Fast forward to today, June 24th, and we can see that the Trade Wars continue to be fought on multiple fronts, including the European Front.
Specifically, from Bloomberg:
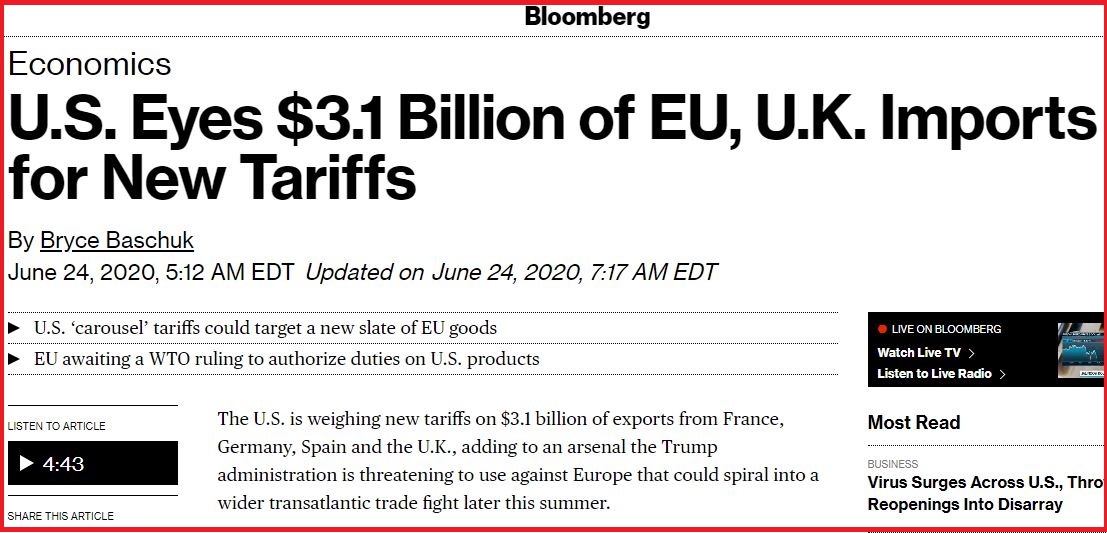
With trade tensions considered, now consider the following: Increasing trade tensions are amidst increasing domestic challenges in other areas, including a pandemic that continues to show a rise in cases in the US, socio-political tensions regarding race in general and police treatment and the appropriateness of public monuments specifically, and socio-economic uncertainties including job losses that continue to mount and a not insignificant number of Americans having difficulties servicing their debts, including mortgages, to name a few.
And yet, the Nasdaq continues to hit fresh, all-time highs:
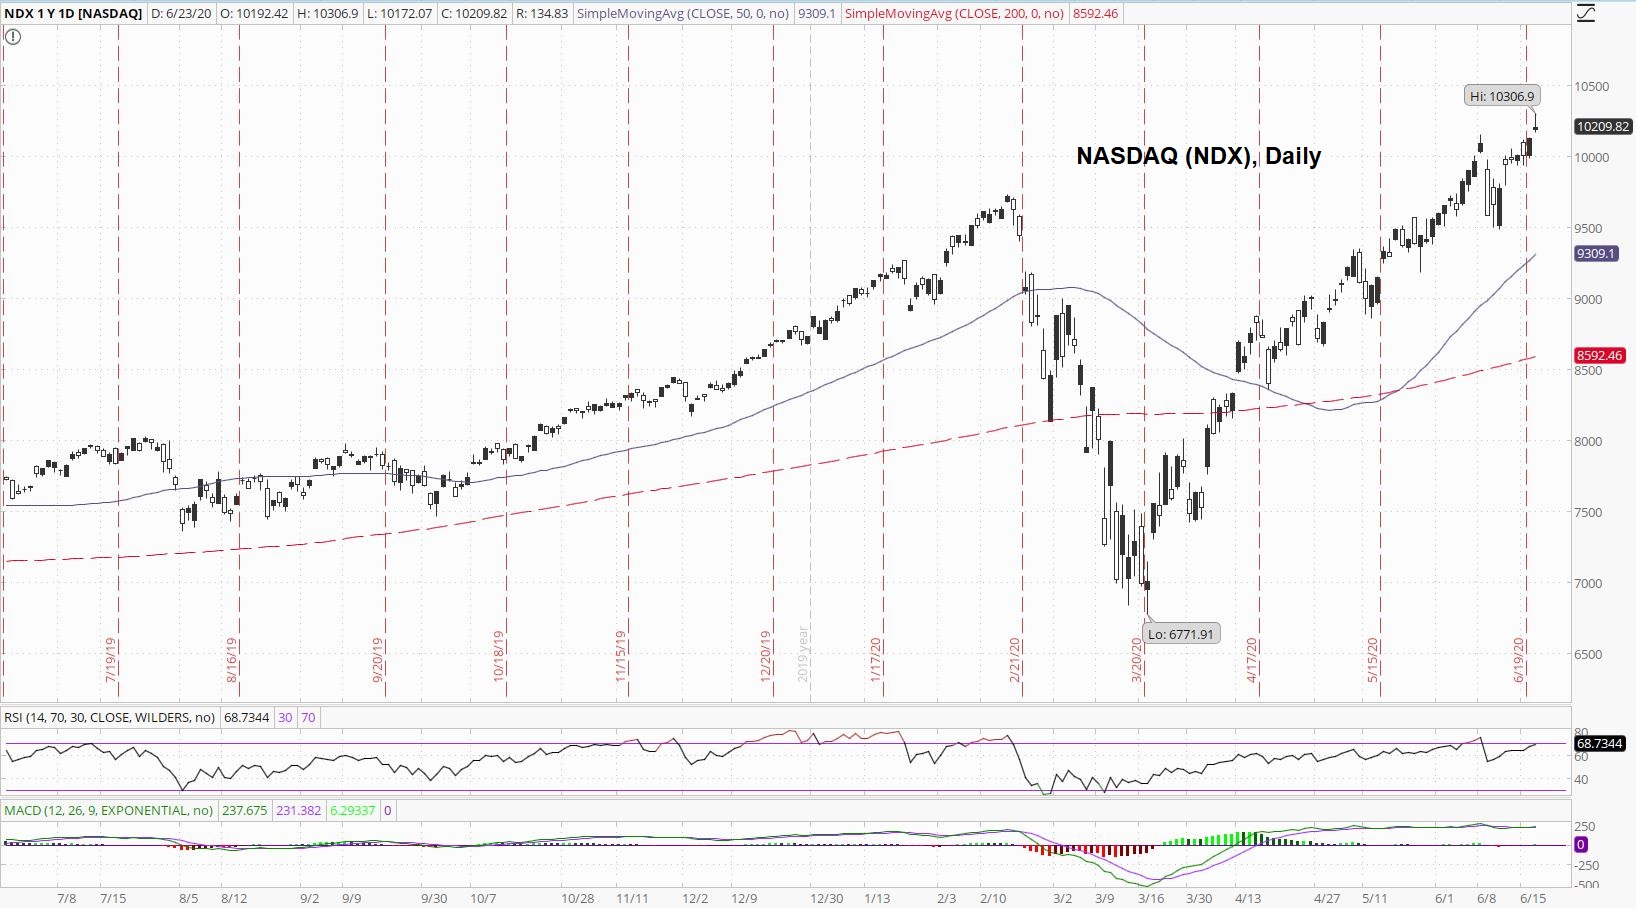
There's still a whole lot of trading left before the end of the week, however, and the end of this week isn't even the end of the quarter because that's next Tuesday!
The VIX is riding its 50-day moving average:
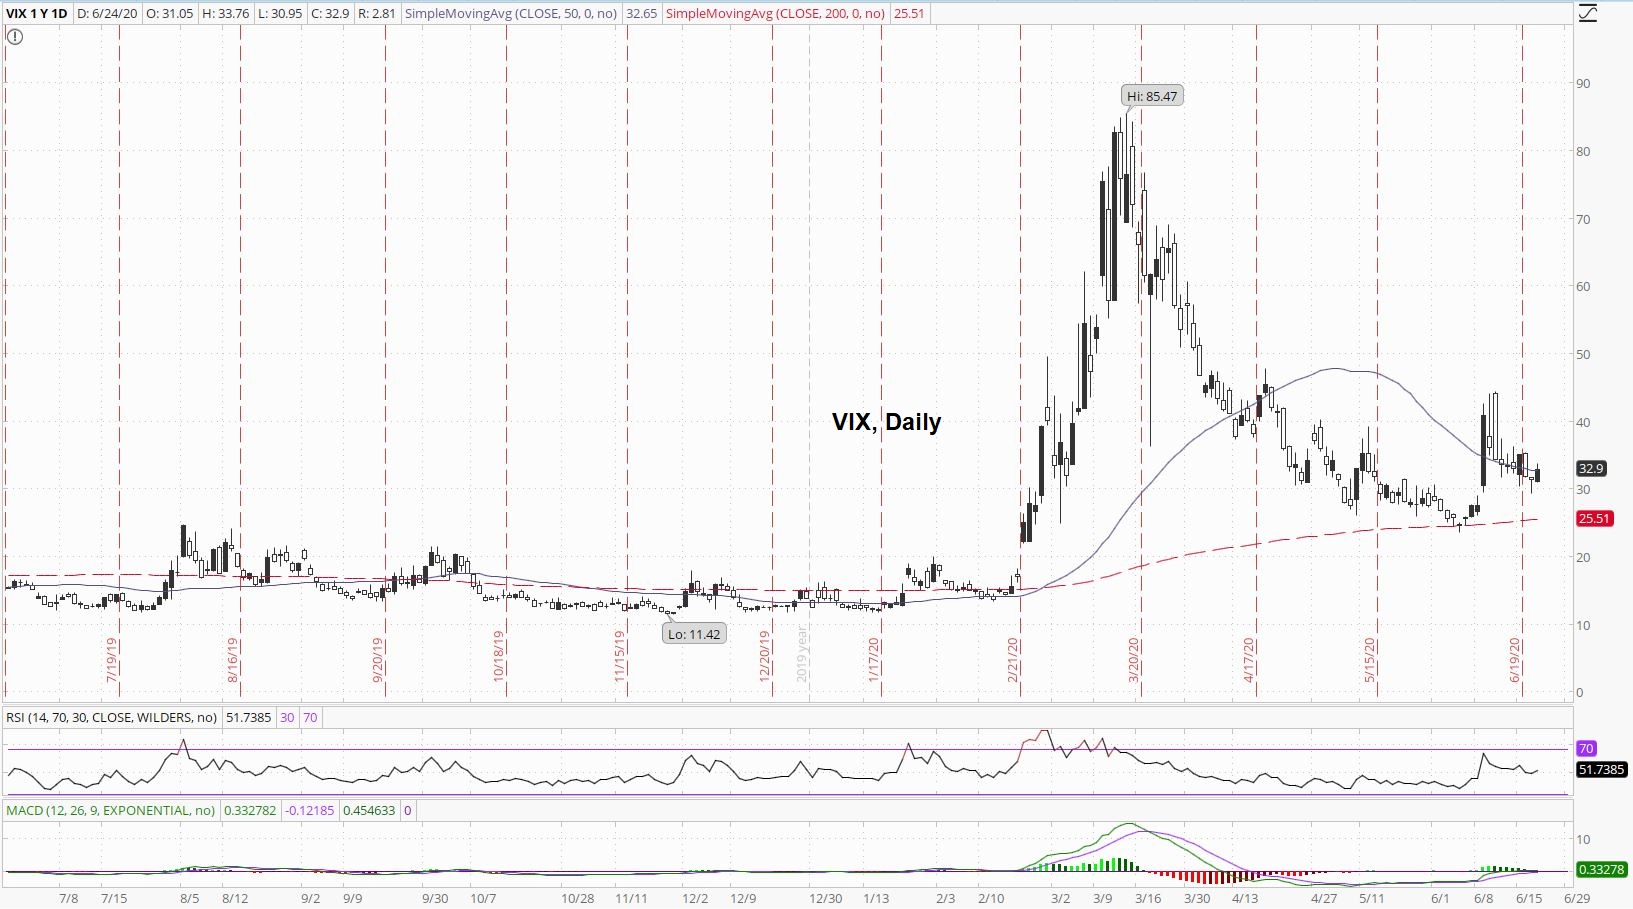
It would not be surprising to see some spiking volatility before the quarter is over.
Yield on the 10-Year Note could now be considered in an uptrend:

A drop in the stock market would likely include a move into US Treasurys, which would send yields lower, however.
All things considered, in a world of ultra-low and even negative interest rates, there's a lot of room between 0.75% and zero.
If the Trade Wars are heating up, the Currency Wars will likely heat up as well:

Regardless, when looking at the technicals, if the DXY breaks below 96, there's the very real possibility the bottom could fall out.
Crude oil has indisputably filled its gap:

It's now a nail-biter for anybody who has a stake in the oil industry in general, and especially a stake in which way the price of crude oil goes from here.
Copper continues to climb what could only be considered one monster, epic Wall of Worry:

It should be noted, however, that the price of copper is still down, year-to-date.
To say Palladium is in a tough spot on the chart would be an understatement:

We've barely seen much range at all in the price action, we've got that lower-high and what could possibly be a lower-low to contend with, and on top of those two issues, we're at the convergence of two major moving averages, of which the divergence will be a resulting "death cross".
Platinum is also having a rough go of it:

Platinum is still down over 10%, year-to-date.
The gold-to-silver ratio has soared back to nearly 100:

It should be noted, however, that both metals are rising in price!
Granted, gold has stolen the show, and rightly so:

We've just hit multi-year highs, and arguably, gold's daily chart is one of the most bullishly healthy charts out there.
Zooming out a little, we can see it has certainly been a while:

It has been eight years, and it has been both a struggle, especially for investors who began investing in gold in the last ten years, but it has also been a blessing, for affording new investors with the opportunity to acquire gold at such a good value.
Silver's daily chart is starting to look at all sorts of bullish, and we're about to see the "golden cross":

Many of the bulls were concerned about a head-n-shoulders chart pattern forming, but as the days go on and invalidate the chart pattern, the plunge becomes less likely.
Thanks for reading,
Paul Eberhart